Using the Vision Easy Chart
Trends Made Easy
The Easy Chart was developed with the Tag Historian system in mind. Once an Easy Chart is created, you can drag and drop historical Tags onto the chart. The chart will immediately retrieve the results and trend the history. Data that is not set up with Tag Historian can also be displayed on the chart, as long as the data has timestamps associated with the values. For this type of data, database pens are created and displayed.
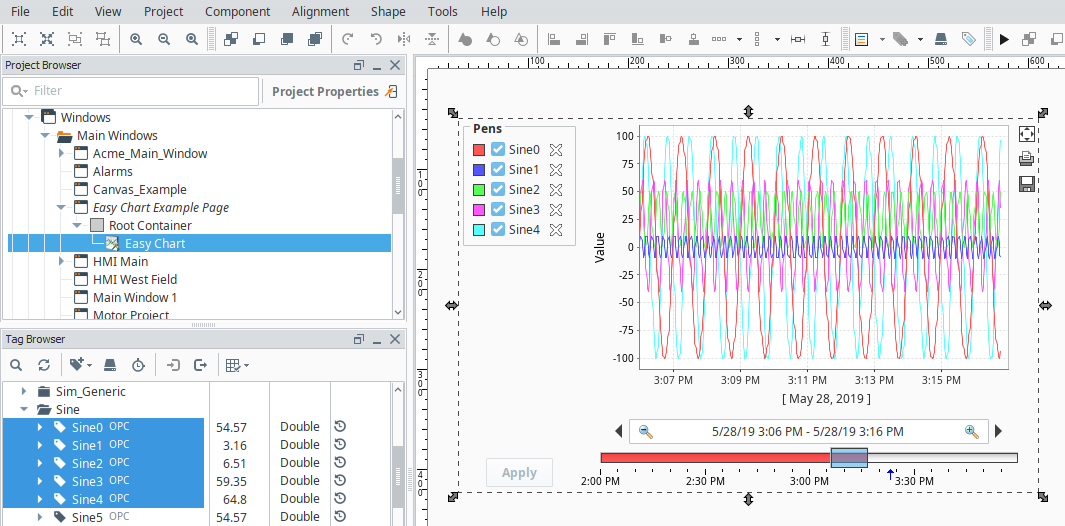
Chart Modes
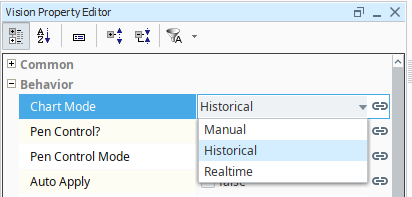
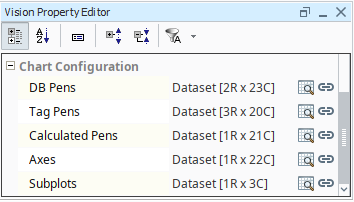
The Easy Chart has a Chart Modes property that changes the behavior of the chart in several ways. The three chart modes are Historical, Realtime, and Manual. The mode is set in the Vision Property Editor in the Chart Mode Property.
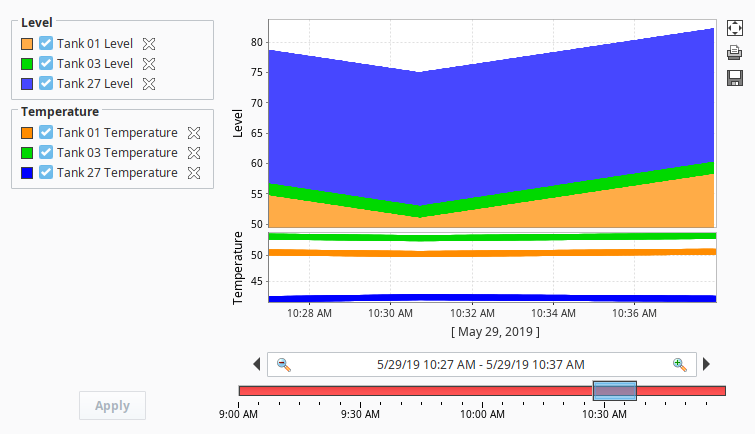
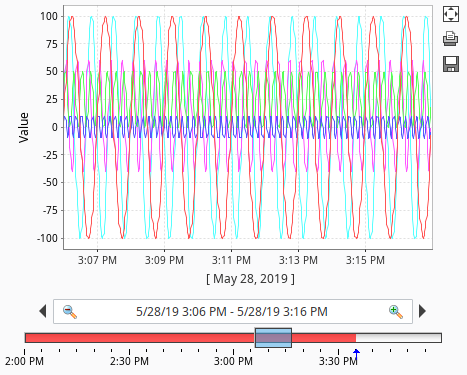
Historical
This mode places a Date Range Selector component at the bottom of the chart. This mode allows users to select a start and end date for the trends. The data density is shown at the bottom of the chart: the more vibrant the color, the higher the density. This the default mode, and commonly used in situations where users need to look at specific date ranges. It is important to remember that the chart does not poll in this mode. New values are only added to the chart when the selection box is moved or re-sized.
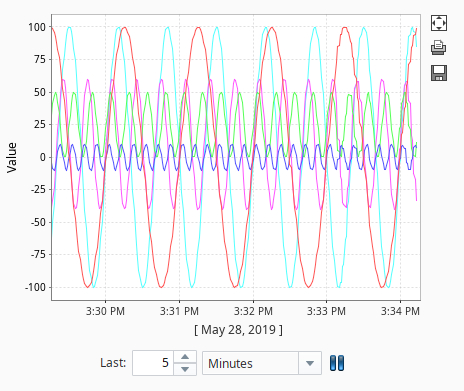
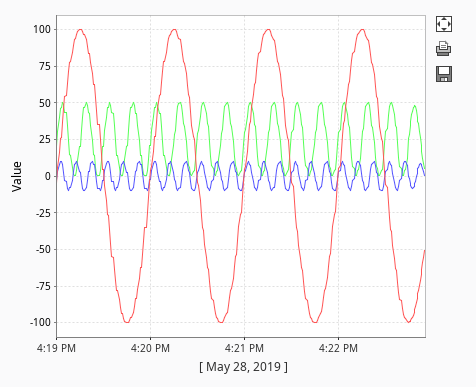
Realtime
Displays the most recent data for each pen. Users are able determine how far back in time the trend should display with the Spinner and Dropdown components at the bottom of the chart. In this mode, the chart polls for data at the rate specified by the Poll Rate property.
In some cases, you may notice that the most recent values on tag pens tend to flat-line, and then 'snap' to a different value. This is generally due to how often the chart polls versus how often history is being generated. If the chart polls at a 1,000ms rate, but history is only recorded at a 10,000ms rate, then the chart will extrapolate the last recorded value for 9,000ms. After a new value is recorded, the next poll will return the latest value, and the flat-line will change position.
Manual
Similar to the Historical mode in that trends range from two points in time. However, there is not a built-in method for users to change the data range. Instead, some sort of binding can be applied to the chart's Start Date and End Date property. This mode is generally used in situations where only certain date ranges should be shown, such as values recorded during the previous day, or shift.
Pens
Pens on the chart, or each series of data points on the chart, can be customized to take on a number of different styles and colors. There are three types of pens, and each pen functions in a similar manner. What makes them different is how their data is collected.
-
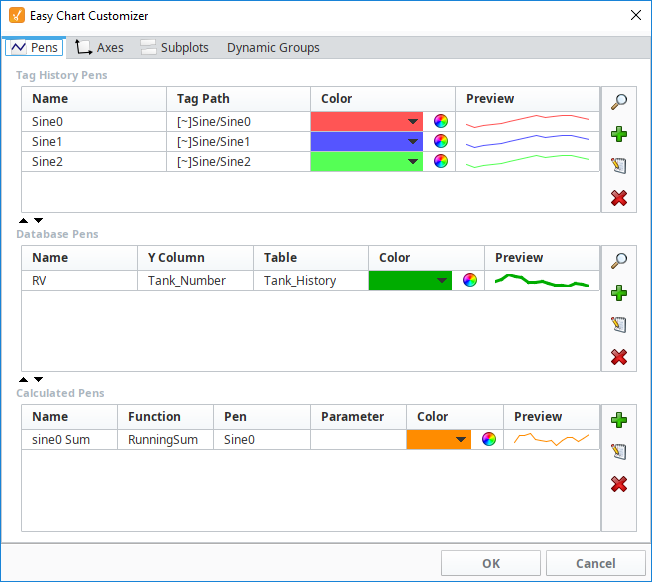
Tag Pens - These pens are driven by the tag history system. Data from any historical provider can be used, and tag history from different databases can be shown on the same chart. These are the type of pens that are created when tags are dragged onto the chart. Since the Tag History system is being used, an Aggregation Mode must be selected, and the Tag Path needs to be specified for each pen.
-
Database Pens - These pens are driven by a SQL query, so they are ideal to use when trending Transaction Group data. However they can query for data in any connected SQL database, so it is possible to show historical data recorded by other systems on the Easy Chart.
-
Calculated Pens - Pens that derive their data from calculations performed on other pens. Data for calculated pens is not stored directly into a database, but rather calculated in the runtime based on data from another pen. These type of pens are great for display running totals, control limits, or specification limits.
Pens can be added manually to the chart with the Easy Chart Customizer or added dynamically by modifying the various pens properties listed under Chart Configuration in the Vision Property Editor. These properties contain the configuration of each type of pen and can make use of the binding system. Because of this, pen preferences can be saved to a database table and then queried in the runtime with a SQL binding. Additional adjustments can be made with Cell Update bindings or scripting to create a dynamic-yet-robust chart.
When you add pens to the Easy Chart, all pens will show up with a white X next to their name. This exists for creating an ad hoc chart used with the Tag Browse Tree component. To remove the ability to delete pens, you must edit the Tag Pens dataset property. Click on the dataset viewer icon, then in the last column "User Removable", deselect the checkbox and click OK.
Easy Chart Customizer
Aside from the properties on the component, the Easy Chart Customizer allows modifications to be made to the chart. Along with configuring pens, the customizer can be used to create subplots new axes, and dynamic groups. Once created, each pen can be assigned to any available axes or subplots. This way different values can be shown on different plots with an axis that is specific to data at hand.