Vision - Easy Chart Customizer
Description
The Easy Chart component allows you to display the history of your Tags on a chart. When you drag and drop Tags onto an Easy Chart, it automatically trends the data for you. It has a special customizer that has some default settings to help you get started.
Customizers
The Easy Chart Customizer allows you to easily modify the chart to your own style. You can add pens and modify the contents of your pens, and create new axes, subplots, and pen groups. When you open the customizer, you'll notice four tabs at the top of the window: Pens, Axes, Subplots, and Dynamic Groups. Each have their own properties.
Shown below is each tab in the Easy Chart Customizer listing all its properties along with a brief description.
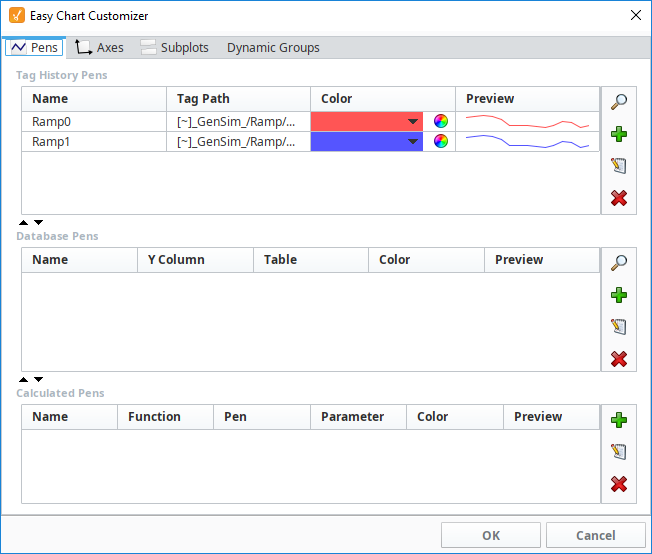
Pens Tab
The Pens tab is where you can add new pens, create custom names for your pens, and group pens. There are three types of pens, and each functions in a similar manner, but what makes them different is how their data is collected. Each pen type has a few unique properties and is listed at the bottom of the table.
- Tag pens - Pens are driven by the Tag history system. (Data from any historical provider can be used).
- Database pens - Pens that are driven by an SQL query. They can query for data in any connected SQL database.
- Calculated pens - Pens that derive their data from calculations performed on other pens.
For more information, refer to the following sections:
| Property | Description |
|---|---|
| Add pen (Browse for Tags). | |
| Add a pen manually. | |
| Edit pen. | |
| Delete pen. |
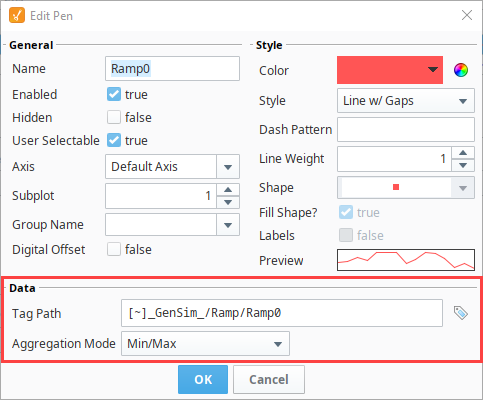
Edit Pen Panel
| Property | Description |
|---|---|
| Name | The name of the pen is what the user will see in the legend and the pen panel. |
| Enabled | If false, this pen will not show up on the chart and the data will not be generated. The user will be able to enable it via the pen control panel. |
| Hidden | If true, the pen will not show up on the chart or the pen control panel. The data will be generated. |
| User Selectable | If false, the pen will show up on the chart, but not the pen control panel. |
| Axis | Select the Y axis this pen will use. |
| Subplot | Putting pens on separate subplots can increase chart clarity. |
| Group Name | The group name is used for logical grouping in the pen panel and for advanced dynamic grouping. |
| Digital Offset | If true, a small gap will be placed between this and other digital pens so they don't overlap each other. |
| Color | Pen color. |
| Style | The style of the pen determines how it looks in the chart. |
| Dash Pattern | Uses a dash pattern like "5,5" to specify 5 pixels on, 5 pixels off. |
| Line Weight | The thickness of the pen's line. |
| Shape | If the renderer style uses shapes, this will be the shape for each point. |
| Fill Shape | If true, the shape will be filled in rather than an outline. |
| Labels | If true, shows a label of the value above each bar. |
| Preview | Field where you can view the pen style. |
Tag History Pens Properties
| Property | Description |
|---|---|
| Tag Path | String-based path where the Tag is located. |
| Aggregation Mode | Type of calculation. See Aggregation Mode for more details. |
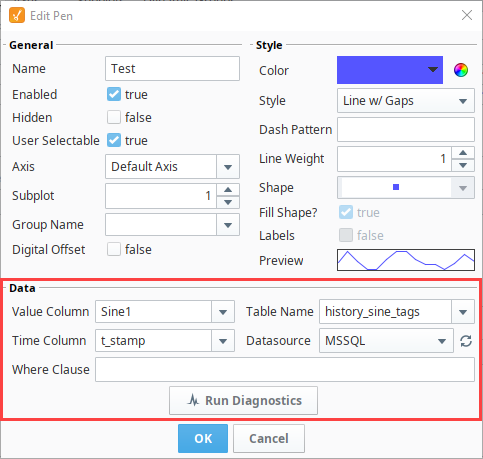
Database Pens Properties
| Property | Description |
|---|---|
| Volume Column | The name of the column for the pen's value (Y value). |
| Time Column | The name of the column for the pen's timestamp (X value). |
| Table Name | The name of the table where the pen will be found. |
| Datasource | The name of the datasource to use for this pen (MySQL). |
| Where Clause | You can specify a snippet of WHERE clause here, like "TankNum = 16." |
| Run Diagnostics | Test this pen for data configuration for validity. |
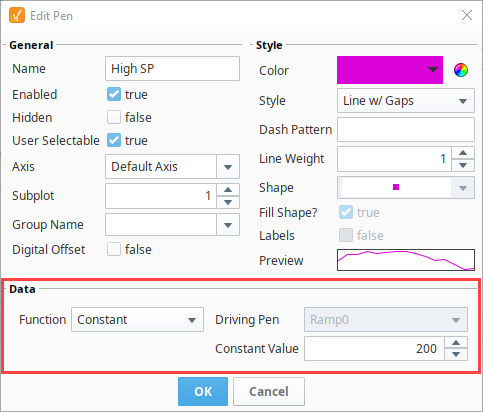
Calculated Pens Properties
| Property | Description |
|---|---|
| Function | Function is the type of calculation (i.e., Constant, UCL, UWL, Avg, LWL, LCL, MovingAvg, Multiply, Min, Max). |
| Driving Pen | Dedicated pen that will drive the value. |
| Parameter | Value which is the horizontal line drawn on the graph. The parameter type can be different for the Function used:
|
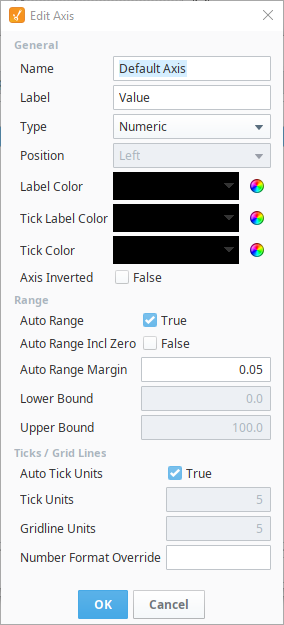
Axes Tab
The Axes tab is where you can configure multiple axes on the Easy Chart component.
| Property | Description |
|---|---|
| Name | The name of the axis is what pens use to refer to it. |
| Label | The label will be displayed on the chart next to the axis. |
| Type | The type of axis determines the plotting behavior. (i.e., Numeric, Logarithmic, Symbol) |
| Position | The position of the axis, if automatic, axis positioning is turned off. |
| Label Color | Color of the label. |
| Tick Label Color | Color of the tick label. |
| Tick Color | Color of the tick mark. |
| Axis Inverted | If true, inverts the axis. |
| Auto Range | If true, the axis will automatically scale itself to the data, rather than display a fixed range. |
| Auto Range Incl Zero | If true, forces the auto range to include zero. |
| Auto Range Margin | The extra margin (as percent of the total range) for the top and bottom of an auto range axis. |
| Lower Bound | The lower bound of a non-auto-ranging axis. |
| Upper Bound | The upper bound of a non-auto-ranging axis. |
| Auto Tick Units | If true, the distance between the tick marks and the gridlines will be automatically calculated rather than a fixed number. |
| Tick Units | If false, this amount will be used as the distance between tick marks. |
| Gridline Units | If false, this amount will be used as the distance between gridlines. |
| Number Form Override | Specifies a number format pattern to use for tick labels. Leave blank for automatic number formatting. |
For more information, refer to the Easy Chart - Axes page.
Subplots Tab
The Subplots tab is where you can break up a chart's plot area into multiple distinct subplots that share the X axis, and also where you can add additional subplots.
| Property | Description |
|---|---|
| Plot Number | Number of plots in a chart plot area. |
| Relative Weight | Ratio between all subplots. (If you have two subplots, and Plot 1's weight is 3 and Plot 2's weight is 1, then Plot 1 will be 3 times larger than Plot 2). |
| Custom Background | If false, the default background is white. |
| Background | Color of the plot area's background. |
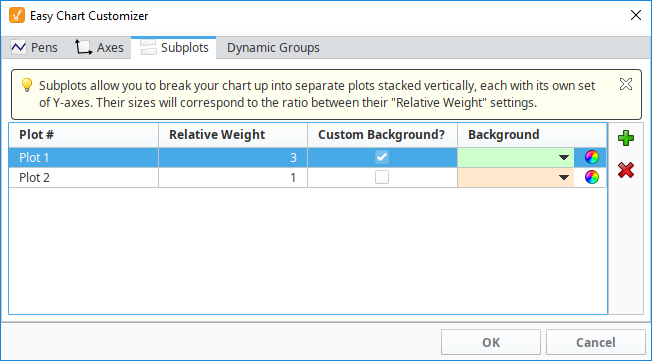
Once you add a subplot, go to the Pens Tab, edit your pen, and put your pen into a different subplot.
For more information, go to Easy Chart - Subplots.
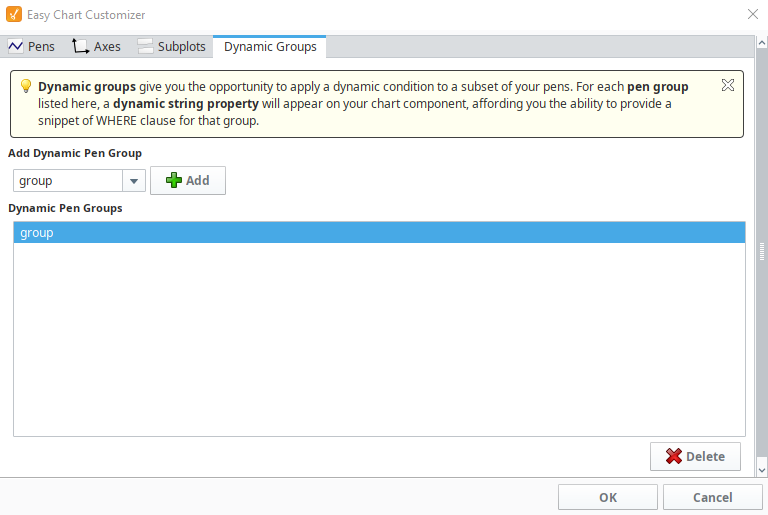
Dynamic Groups Tab
Dynamic Groups are used with Database pens. They allow you to apply a dynamic condition, like using a WHERE clause, to a subset of pens. For each pen group, a dynamic string property will appear in the Property Editor under Custom Properties of your Easy Chart component. You can create a WHERE clause that will search the database and return values if the pens meet a true condition.
Property Editor - Custom Properties - Where Clause for Dynamic Group Property
![]()
To learn more about Dynamic Groups, refer to the Easy Chart section.