Tag History Bindings in Vision
Binding Properties to the Tag Historian
The Tag Historian binding type, which is only available for Dataset type properties, runs a query against the Tag Historian.
Selected Historical Tags
For this type of query, you must select at least one Tag path from the Available Historical Tags to query. The Dataset returned by the query will have a timestamp column, and then a column for each path that you select here.
Date Range
Choose either a Historical or Realtime query. Historical queries use a date range that must be bound in from other components on the screen, typically a Date Range or a pair of Popup Calendars. Realtime queries always pull up a range that ends with the current time, so all they need is a length.
Please note that intervals returned by Historical queries are inclusive of the End Date, including when the End Date is set to now(). This means you may see one additional interval than expected that only contains future dates, which get interpolated to 0 and can cause trending issues.
For example, if you want data from 10am - 11am in 1 minute windows, you’ll need to set your query from 10am-10:59am. Querying to 11am would create an interval to contain it and that window will often return 0 since there is typically no future value. Additionally, if you went on to add the results of two queries of adjoining times, such as 10am - 11am and 11am - 12pm, the first window of the second period would have duplicate data to the last window of the first period.
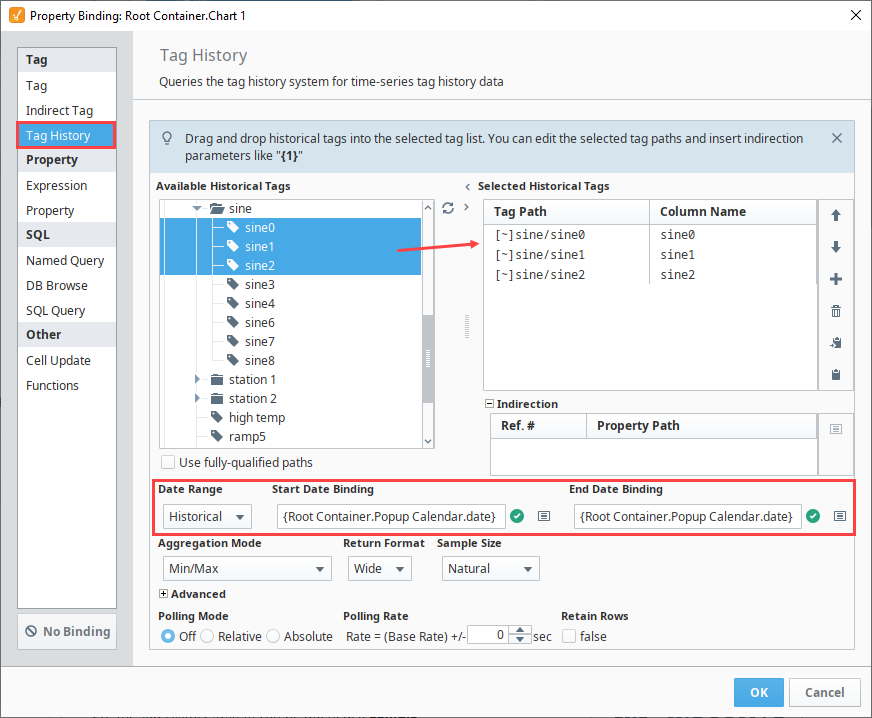
This example uses a Historical query and two Popup Calendars for the start and end dates. The history is presented in the Table below.
-
In the Designer, drag two Popup Calendar components and a Table component from the Component Palette into your workspace.
-
Select the Table and right click on the Binding
 icon for the Data property.
 -
Drag a sine0, sine1, and sine2 under the Tag Path column under the Selected Historical Tags area.
-
Under Date Range, select Historical.
-
Under Start Date Binding, click on the Property
 icon and under one of the Popup Calenders, select Date.
 -
Under the End Date Binding, click on the Property
icon and under the second Popup Calender, select Date. -
Click OK.
-
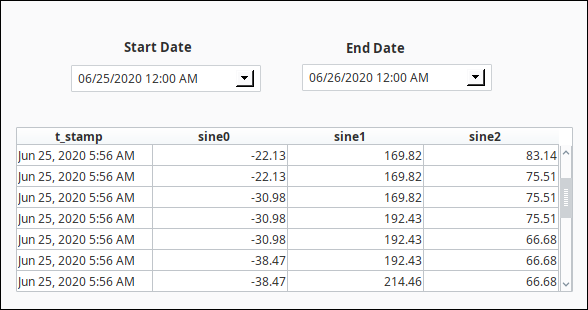
Now you can see the history of the three Sine tags along with a timestamp. You can scroll through the information in the table to see the history that was logged. To change the date range, click on dropdown buttons to bring up the popup calendars to change the date range. The tag history binding type allows you to bring back this history.
Sample Size and Aggregation Mode
In places where the Tag History system can be queried, a Sample Size and Aggregation Mode can be selected that will determine how the results will be queried out and how the raw values will be aggregated.
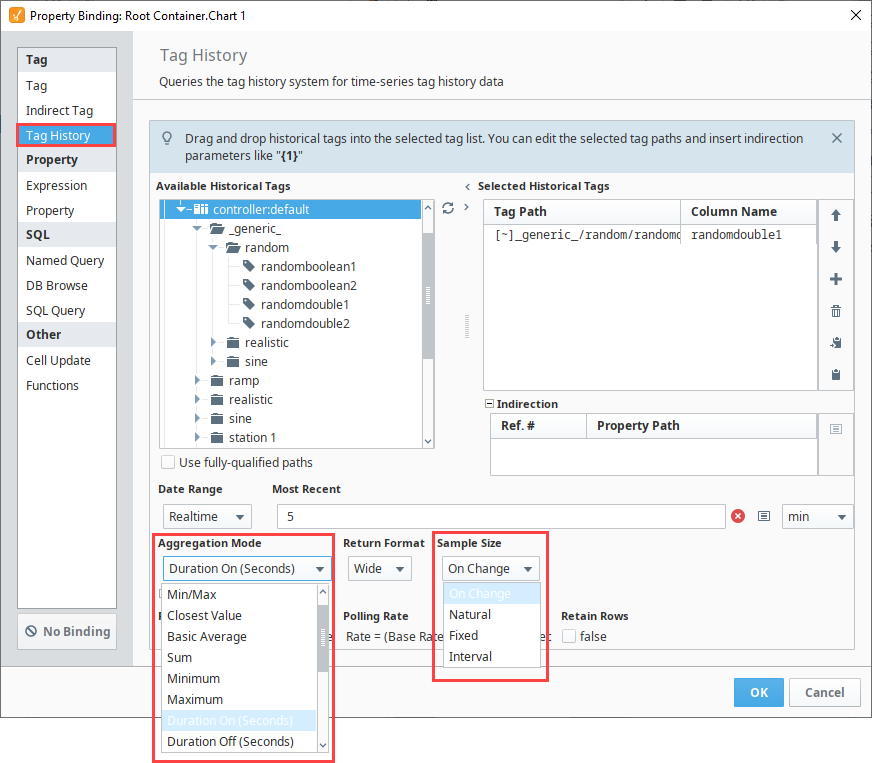
Aggregation Mode
The Aggregation Mode dictates what happens when multiple raw values are encountered for a given time slice. The number of values within a time slice is determined by the Sample Size properties. For more information on how time slices are populated, see the How the Tag Historian System Works page.
| Aggregation Mode | Description |
|---|---|
| Time-weighted Average | The values are averaged together, weighted for the amount of time they cover in the interval. Note: In scripting, Time-weighted Average is instead labeled Average. These are the same. |
| Min/Max | The minimum and maximum values will be returned for the window. In other words, two rows will be returned. If only one value is seen in the time slice, only one row will be returned. |
| Closest Value | The value closest to the ending time of the interval will be returned. Note: In scripting, Closest Value is instead labeled Last Value. These are the same. |
| Basic Average | The values are summed together and divided by the number of values. Note: In scripting, Basic Average is instead labeled Simple Average. These are the same. |
| Sum | The values in the time slice are summed together. |
| Maximum | The maximum value in the time slice. |
| Minimum | The minimum value in the time slice. |
| Duration On | Returns the number of seconds that the value was recorded as non-zero. |
| Duration Off | Returns the number of seconds that the value recorded as zero. |
| Count On | Returns the number of times the Tag's value went from a zero value to non-zero. |
| Count Off | Returns the number of times the Tag's value changed from a non-zero value to zero. |
| Count | Returns the number of times a value was recorded |
| Percent Good | Time-weighted percentage of good values over the date range. |
| Percent Bad | Time-weighted percentage of bad values over the date range. |
| Range | Returns the range between the highest and lowest value for the period. Changed in 8.1.17 Range mode will return "0" if the historical tag value remains static over the given Time Range. |
| Standard Deviation | Returns the standard deviation of values, or how much spread is present in the data; low standard deviation shows the values are close to the mean, and high standard deviation shows that the data points are spread out over a large range of values. Only good quality values are used when calculating |
| Variance | Returns the variance of values. Similar in concept to standard deviation. Only good quality values are used when calculating. |
Sample Size
The sample size determines how many data points will be returned from the query.
On Change
An On Change query will return points as they were logged, and can be thought of as a "raw" query mode. This means that the results may not be evenly spaced. Also, it is important to note that every changed value will result in a row, and therefore if you are querying multiple tags and once, you may end up with more rows than you anticipated. For example, if Tag A and Tag B both change, you would end up with [[A0, B0],[A1, B0], [A1, B1]].
If you want to essentially retrieve raw values, while coalescing them down into fewer rows, try using the Interval sample mode, with an interval set to your largest acceptable time between rows, and select "prevent interpolation" from the advanced settings.
Natural
A Natural query will look up the logging rate for the queried tags (when possible), and return results spaced apart at that rate. This means that the return size will vary with the date range.
Fixed
You can use the Sample Size and Aggregation Mode on the Tag History binding type to fix the number of records that are retrieved. The Fixed sample size will cause the binding to retrieve all records from the date range, and aggregate them evenly between a fixed number of points. This will ensure that the number of rows will remain the same without regard to the size of the dataset. In windows where users are able to select a large range of data, Fixed is recommended as it will prevent the property from loading an excessive number of records.
In cases where the number of points can not evenly represent the data from the date range, an extra point will be added, making the final size of the dataset the fixed value + 1.
Selecting the Min/Max aggregation mode returns two rows of data for every row requested. Each pair represents a minimum and a maximum result from the underlying data. Therefore, a table with a fixed length, would return double the requested amount with Min/Max aggregation mode selected. With Min/Max aggregation mode selected, and with a fixed row length of one, the data set returns the oldest tag value of the time range
The following image shows a Tag History Binding pulling data from the last one day. The Sample Size is configured to Fixed with a value of 100, and the Aggregation Mode is set to Basic Average. This means that the binding will query for data from the last one day, regardless of how many records there are, and create 100 time-slices that are evenly dispersed between the start and end periods of that range. Then, a basic average of the tag values are calculated for each time-slice. The resulting values are then returned to the property.
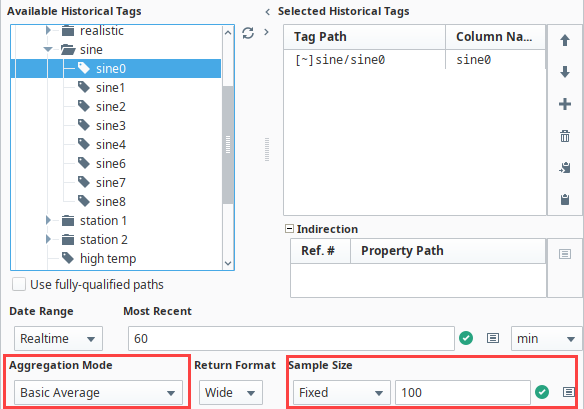
Note the Insert Property ![]() icon next to Sample Size. This allows a property binding to determine the number of data points, so you could change the size to increase or reduce the amount data points on the chart from the client.
icon next to Sample Size. This allows a property binding to determine the number of data points, so you could change the size to increase or reduce the amount data points on the chart from the client.
Interval
Where as the Fixed sample size will calculate time slices based on the date range, the Interval sample size allows you to determine the size of the time slices. This sample size will divide the date range by the interval size to determine the size of each slice. Because of this, it is recommended to use an interval that is evenly divisible by the date range. However, in the event that the date range is dynamic or user driven, interpolation will handle any partially built slices. Even though the binding may attempt to evenly distribute the slices, there may be an extra row that represents the current values as they are building an interval.
The image below shows a Realtime range of 60 minutes. The Aggregation Mode is set to Time-weighted Average, and the Sample Size is set to Interval for 5 minutes. This means that the binding will query for data ranging from 60 minutes ago to now (or whenever the binding last executed, in the case that polling has been turned off). That 60 minute window will be divided as evenly as possible into 5 minute time-slices, so there should around 12 time-slices. Each time slice will aggregate its value based on the time-weighted average of all values within that slice.
The example uses a Realtime range, but a Historical range could easily be used instead.
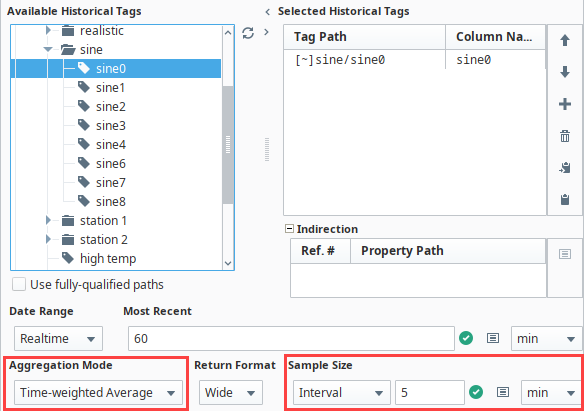
Note the Insert Property ![]() icon next to Sample Size. This allows a property binding to determine the number of data points, so you could change the size to increase or reduce the amount data points on the chart from the client.
icon next to Sample Size. This allows a property binding to determine the number of data points, so you could change the size to increase or reduce the amount data points on the chart from the client.
Return Format
Return format dictates how the requested data will be returned. The options are "wide" (default), in which each Tag has its own column, and "tall", in which the Tags are returned vertically in a "path, value, quality, timestamp" schema.
Advanced Options
These options affect the query results in more subtle ways.
- Ignore Bad Quality - Only data with "good" quality will be loaded from the data source.
- Prevent Interpolation - Requests that values not be interpolated, if the row would normally require it. Also instructs the system to not write result rows that would only contain interpolated values. In other words, if the raw data does not provide any new values for a certain window, that window will not be included in the result dataset.
- Avoid Scan Class Validation - "Scan class validation" is the mechanism by which the system determines when the Gateway was not running, and returns bad quality data for these periods of time. By enabling this option, the scan class records will not be consulted, which can improve performance, and will not write bad quality rows as a result of this check.
- Bypass Tag History Cache - New in 8.1.5A "Bypass Tag History Cache" checkbox was added on Vision Tag History bindings which allows the option for the Tag History cache to be ignored on a per-binding basis. When the Tag History cache is enabled, query start/end dates are aligned to an existing subcache for performance which may not contain the most recent values. This can lead to a scenario where the last datapoint returned isn't reflective of realtime values if the Tag History binding date range includes the current time. Enabling the "Bypass Tag History Cache" checkbox prevents this scenario.

Polling and Row Options
These options affect data polling, as well as if rows created by a Tag History binding will be retained. Keep in mind that the polling rate will only be available if the polling mode is set to Relative or Absolute.
| Property | Description |
|---|---|
| Polling Mode |
|
| Polling Rate | The rate at which data will be polled. This option will vary depending on what polling mode you have set.
|
| Retain Rows | If true, rows created by this binding in the designer will be saved with the parent window or template. If false, rows will not be saved, which may make window load times faster. Default is false. |


Tag Historian information is often easiest to work with in the Easy Chart component, which handles all of these options automatically.
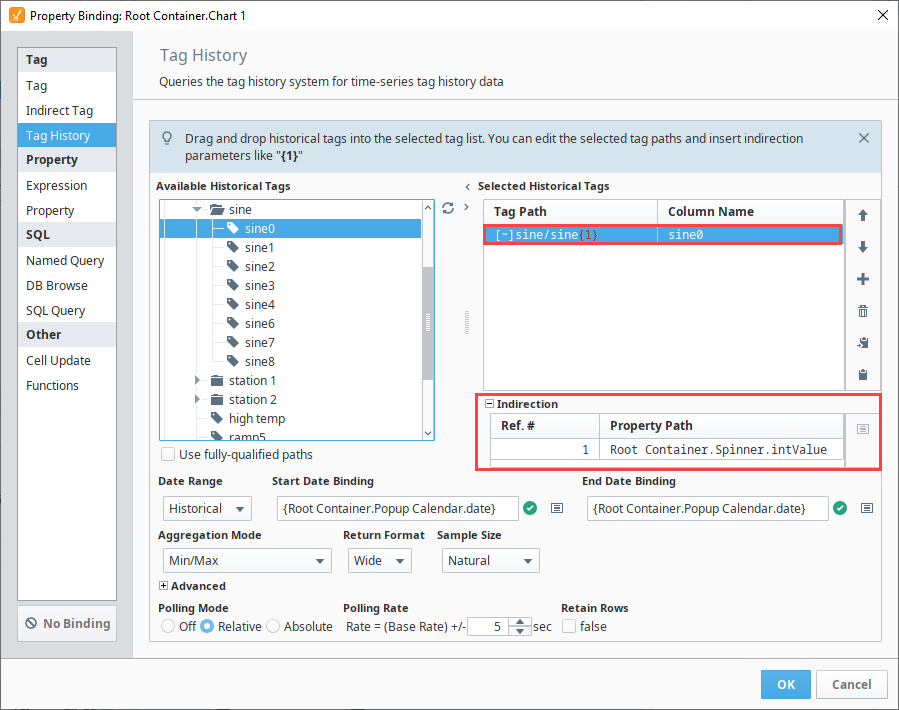
Indirect Tag History Binding
The Tag History Binding can be made indirect by using Indirection parameters in the Tag Paths of the Selected Historical Tags. This works similarly to the Indirect Tag Binding, which uses Indirection References within the Tag Paths to substitute something into the path. Valid Indirection parameters consist of a reference number within curly braces. Simply type the Indirection parameters into a Tag path, selected by double-clicking. In this case, we will enter 1 as our Indirection parameter.
All valid parameters will appear in the Indirection table. For this example, the Tag Path points to the Spinner component for the indirection parameters.