Cell Update Bindings
Binding a Dataset Property to Realtime Values
The Cell Update binding enables you to easily make one or more cells inside a dataset dynamic. This is particularly useful for components such as the Table to easily display realtime Tag information, or in the Linear Scale which stores configuration information in a dataset. The Cell Update binding allows you to bind a cell inside of a dataset to a Tag or to a property.
Cell Update Bindings work really well with the Easy Chart component, allowing you to indirectly show Tag history on the same Easy Chart. See Indirect Easy Chart for more details.
The Cell Update binding type will only appear when setting up a binding on a dataset property, otherwise, it won't be present.
The cell update binding has a few tools that help you make certain cells dynamic.
The top table called Dataset displays the original dataset, while the bottom Cell Bindings table displays each of the cell updates that will be occurring. Each Cell Update binding can have multiple cell updates happening on a single dataset. To the right of the Cell Bindings table are the buttons that are used to create the Cell Bindings:
 Add Row - Adds a new empty row to the Cell Bindings table, which can be customized with a new Cell Binding. If a cell is selected in the Dataset table, it will instead add a row with the Row and Column values already filled in with the appropriate values.
 Delete Row - Removes one of the rows in the Cell Bindings table.
 Insert Property - Inserts a property reference into the Value cell of the selected row.
 Insert Tag - Inserts a Tag reference into the Value cell of the selected row.
 Copy the current selection to the clipboard.
 Pastes the contents of the clipboard into the current context.
Adding Values to the Cell Bindings Rows
Each row in the Cell Bindings table needs three values to work properly:
- A Row identifier, which is used to figure out which row the cell binding is on.
- A Column identifier, to determine the column of the cell.
- A Value, which will replace the original value of the cell.
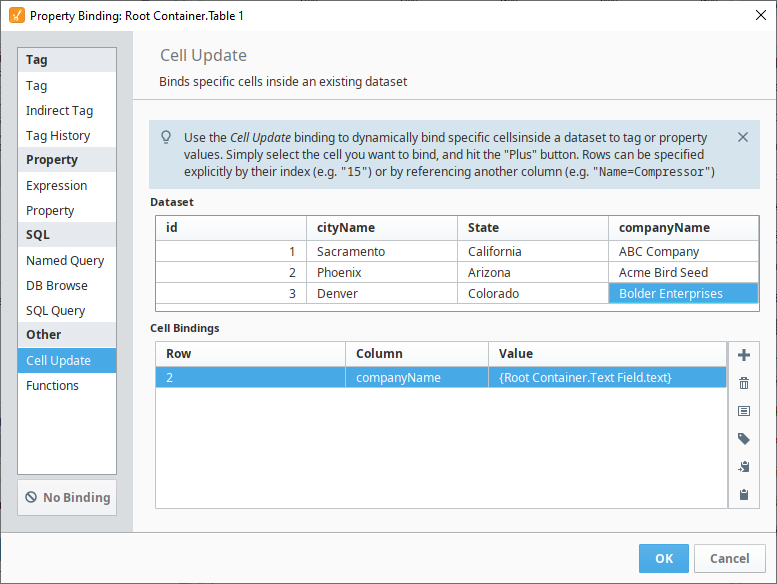
These three values can pinpoint a specific cell, and replace its value with the dynamic Tag or property value specified. The examples in this section use the dataset:
| id | cityName | State | companyName |
|---|---|---|---|
| 1 | Sacramento | California | ABC Company |
| 2 | Phoenix | Arizona | Acme Bird Seed |
| 3 | Denver | Colorado | Bolder Enterprises |
No two rows should specify the same cell, as this will throw an error.
Row Column
The Cell Bindings Row column can be filled one of two ways.
Row Index
The easiest way is by specifying the row index of the cell that you want to target for an update. It is important to remember that the row index is zero based, so the index of the first row is always 0. There can be multiple rows, each with the same row index, as long as the Column is different. The order of the rows in this case does not matter. As the image below show three rows, specified with a row index of 0, then 5, then 0 again.

Column Value
The other way to identify the row that the intended cell belongs to, is to use the value of a different column. This is done using the syntax:
columnName=value
Where the columnName is the name of the column and the value is the value that needs to match. The columnName and value are both case sensitive, so you will need to use care when filling in these values.

There are three things that make using the Column Value unique. The first is that there is the possibility for duplicates to happen. Take the image above, with both a Row index of 0 and a Column Value of 'String Column=Test 1'. Looking at the original dataset, both of those point to the same row, and with both of them pointing to the Boolean Column, they both refer to the same cell in the dataset. This instance of duplicates will not throw an error, but instead will work. In this case, the updates happen from top to bottom, so the 'String Column=Test 1' would be what writes to the cell last and what ultimately gets displayed.
The second is that there is the potential for multiple possible matches to that evaluation. For example, if I had this in the Row value:
Boolean Column=True
This could potentially be true for multiple rows of my dataset, in which case, the binding will apply to all of them. This allows you to change multiple cell values that should all be the same.
The final thing that makes the Column Value unique is that it itself is ultimately dynamic. The 'Boolean Column=True' Column Value matches the rows at index 1, 3, 4, 7, and 9 in the original dataset. However, if any of those were to change to False through another cell update, then that row would no longer be updated as part of this cell update. Conversely, if any of the currently False values were to change to a True, then those rows would fall under this cell update and the appropriate cell will be updated.
Column Column
The Cell Bindings column named Column, or Column column, expects the name of a column that will match in the "Dataset" table above. These values are case sensitive, so care should be taken when entering them manually.
Value Column
The Value column is what will get pushed into the cell that is being updated. There are three possible types of values that can be placed in here.
Static Value
A static value can be written in here. This will overwrite the existing value of the cell with whatever static value is in the cell update. This does defeat the purpose of using the cell update though, since the static value could just be placed directly in the original dataset.
Tag or Property Reference
A Tag or Property reference can be used for the cell updates value, updating the value of the cell whenever the value of the Tag or Property changes. The Tag or Property Selectors to the right of the Cell Bindings table can be used to add in the reference.
When adding a Tag or Property reference, be sure that the cell is only selected and that the cursor is not placed in the Value cell. The cursor in the cell is used for typing in a static value, and trying to enter in a Tag or Property reference will not work.
This is used to enter in static text:
![]()
This accepts Tag and Property references:
![]()
Both Static Values and a Reference
The Value column can also accept a combination of a reference and static values. This allows you to build unique strings or numeric values within the Value cell. The syntax used is:
numbers1234{tagOrPropertyReference}orcharacters
The reference value will be concatenated into the Value at the location specified. For example, if my Value was
{MemoryTags/IntegerTag}000
and the IntegerTag had a value of 5, the updated cell value would be 5000. This method of combining both a reference and a static value is great for updating Tag paths, such as in an Easy Chart's Tag Pens dataset.
[~]Motors/Motor {Root Container.MotorNumber}/Amps
Here, the MotorNumber property on the root container is replacing the motor number inside of the Tag path. See Indirect Easy Chart for more details.
Realtime Tag Values in a Table Example
The Cell Update binding allows you to place the value of a Tag into a dataset easily. With a dataset property like the one on the Table component, getting updating values into it requires either a SQL query, or some constantly running script. With the Cell Update binding, that isn't necessary. The simple static table contains four rows for four different tags, where each has a value. As an alternative, you could use four numeric text fields and labels, but the Table component looks cleaner.

Let's use the table above table to create a Cell Update binding to get the pressure readings into the table.
-
Open the property binding (
 ) on the data property.
 -
Click the Cell Update binding type, and you'll see your dataset along with a Cell Bindings area.
-
Select the first value, and click the Add
icon in the Cell Bindings area to add a row. You'll notice it added a row number, column name, and blank value cell because we selected a cell from above. What you place in the blank Value cell determines what the value will be in the table.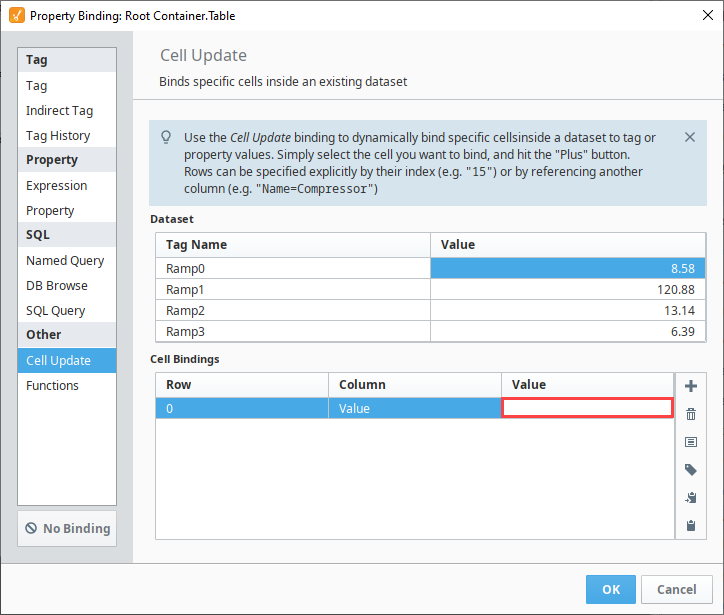
-
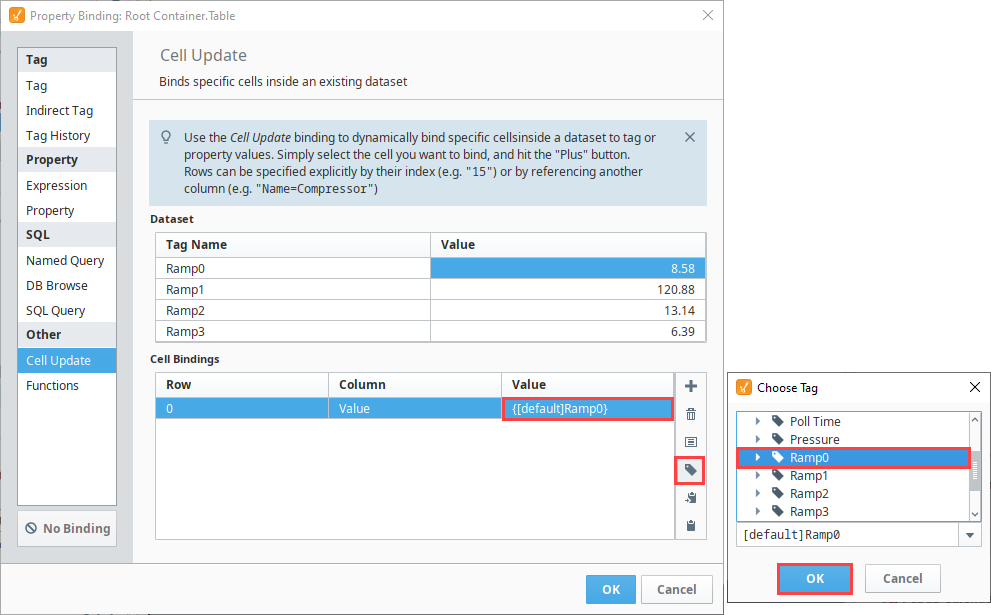
Select the first Row and first Value cell in the Cell Binding area. Use the Tag
icon to the right to select the Tag reference. You can also manually type in your Tag reference, or place in a property reference instead. -
Click OK.
-
Now, you have the value of that Tag to the Value column in row 0. Repeat Step 3 for the other three Tags so that the Cell Binding area looks like the image below, then click OK.
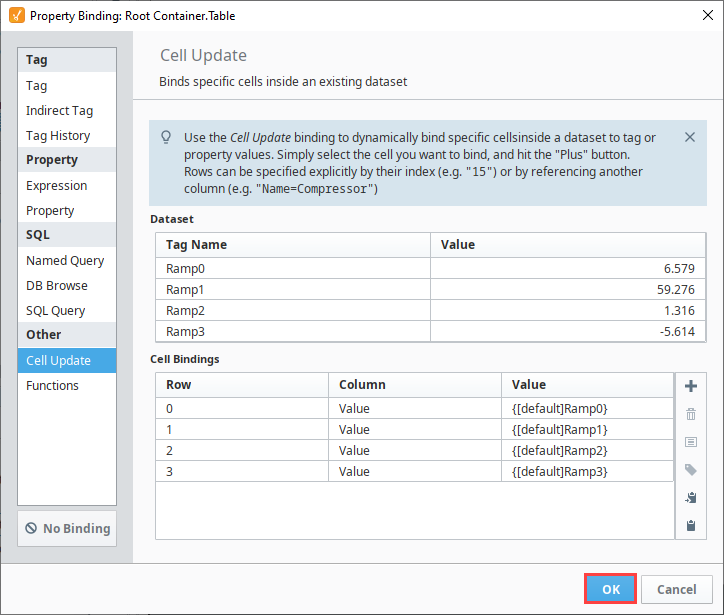
Table values are now updating with the value of their respective Tag.

Adding a Realtime Indicator to the Linear Scale Example
The Linear Scale is a component that has a special Scale Indicators customizer that allows you to configure setpoints. You can set up the value, color, style, and more for each of the indicators. During runtime, these values are normally static, as there is no way to set up a binding in the customizer. However, the customizer merely configures a dataset that the component uses to create the indicators. If you look at the Indicators dataset property of the Linear Scale, it has all of the properties that are configurable in the customizer. Changing them from the customizer will alter the dataset, and changing the dataset values will alter what you see in the customizer. Knowing this, we can set up a Cell Update binding to manipulate the values during runtime.
Let's add another indicator to the Linear Scale component and configure it.
-
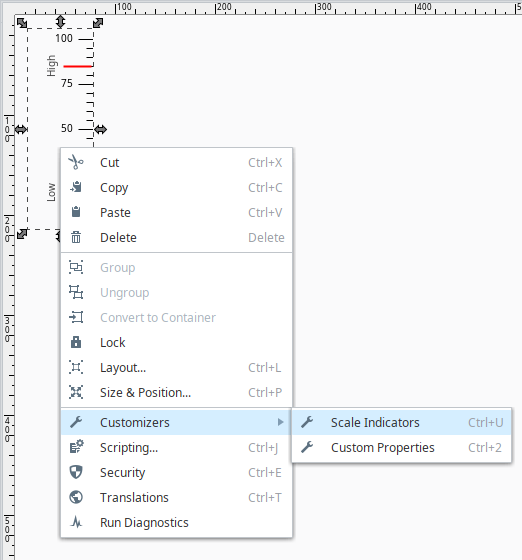
Select the Linear Scale and right click on the Customizers > Scale Indicators.
-
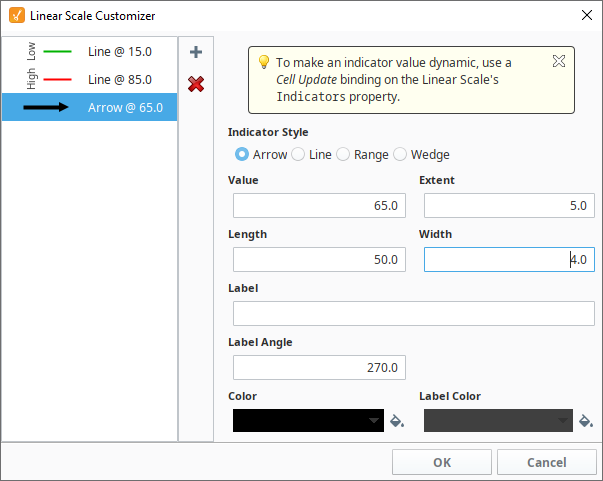
Click on the Add
icon to add a new indicator. -
Click the Arrow radio button and set the following properties for the Arrow.
- Value: 65.0
- Length: 50.0
- Width: 4.0
-
Click OK. This new indicator will be whatever the current value is.
-
In addition to changing the value of the realtime Indicator, you can also change its color based on its value. If the value is above the high indicator (i.e., 85), the Arrow will change to red, and if the value is below the green indicator (i.e., 15), it will change to green. To accomplish this, set up a custom property on the Linear Scale of type color:
-
With the Linear Scale selected, right click on the Customizers > Custom Properties.
-
Click the Add
icon to add a property. -
Enter "Color" as the Name of the property.
-
In the Type column, choose Color from the dropdown list.
-
Click OK to save the custom property.

-
-
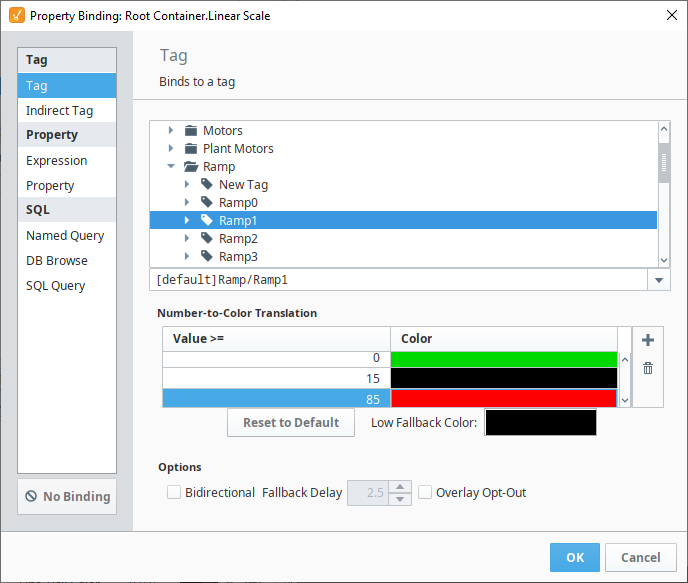
Next, we'll set up a Number-to-Color Tag binding on the custom Color property. Select the Linear Scale component, then click the binding
icon next to the Color property.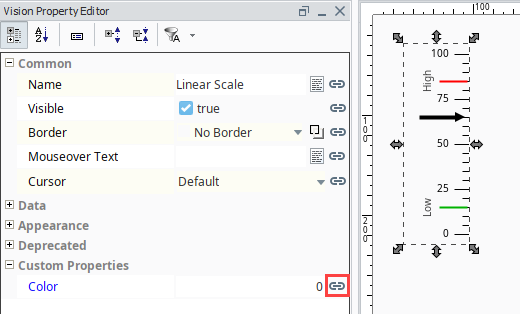
-
The values shown in the image below are based on the static setpoints that were set in the Linear Scale customizer.
-
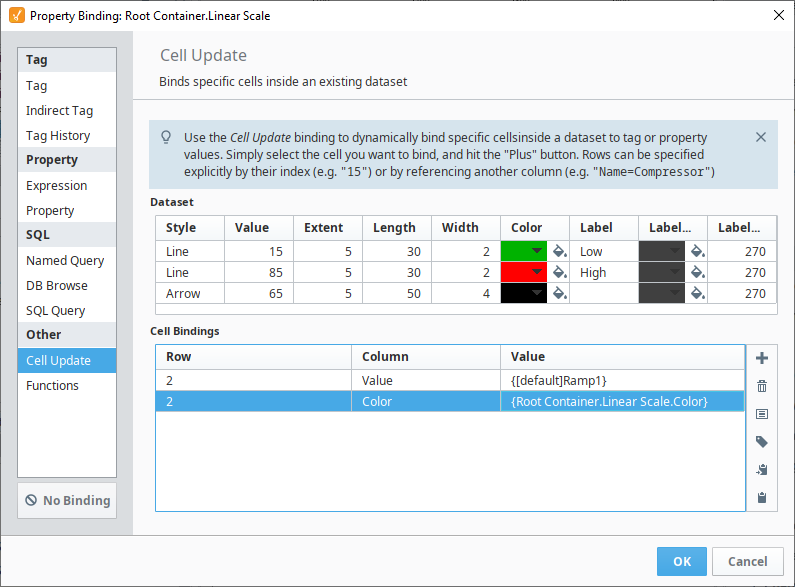
Finally, set up a Cell Update binding on the Indicators dataset property of the Linear Scale. Notice below that both of the cell bindings are for the same row, just different columns. This is fine, as long as there aren't duplicate bindings for the same cell.
-
Bind the Value cell to the same Tag used in the custom property Color binding to get the value:
- Click the Add icon.
- Click the Tag icon .
- Select the Ramp1 Tag,
- Click OK.
- Click the Add
-
Bind the Color cell to the Color custom property we just created.
- Click the Add icon.
- Click the Property icon and select the Color property.
- Click OK.
- Click the Add
-
Click OK.
Now, the Linear Scale has an Indicator that moves to show a realtime value and changes color whenever it goes outside the setpoints. The image below shows the indicator below the setpoint, within range, and then exceeding the setpoint.
