Historian in Vision
The Tag Historian records tag data in a database for later analysis. The Vision module includes several Chart components that can retrieve and display this historical data.
The Easy Chart
The Easy Chart component displays historical tag data from the Tag Historian database. It’s quick to configure and offers several options to customize the chart’s appearance and behavior. The Easy Chart Customizer provides additional settings for detailed control.
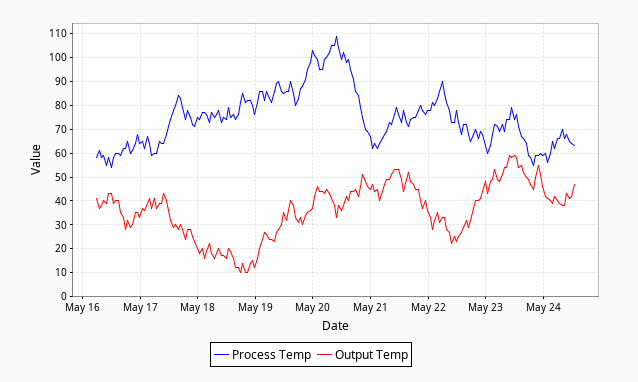
The Classic Chart
The Classic Chart displays historical data from the Tag Historian system. It supports both time-based and category-based trends, making it useful for data that isn’t organized by timestamp.
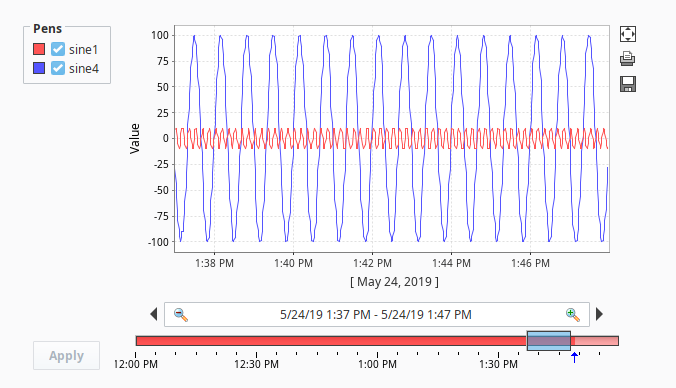
The Sparkline Chart
The Sparkline Chart provides compact trend lines for historical data. Its minimal design makes it ideal for High Performance HMI applications, where muted colors and simple lines highlight key information.

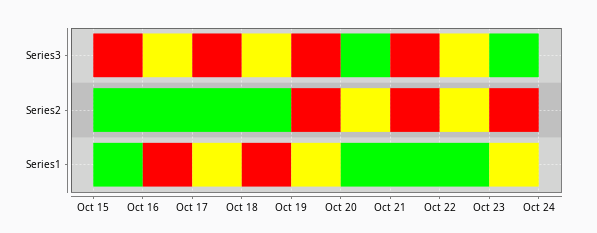
The Status Chart
The Status Chart visualizes discrete or categorical data over time, such as machine states or process modes. It supports both wide and tall data formats, allowing flexibility in how historical information is organized.