Vision - Radar Chart

Component Palette Icon:
![]()
Description
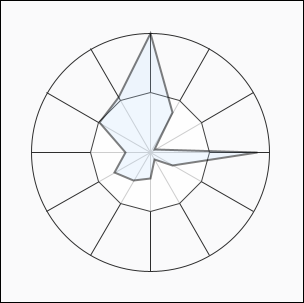
Radar charts, also known as web charts, spider charts, spider plots, and a few other names, display a dataset as a two dimensional polygon. The plot is arranged as a set of spokes with equal angles between them. Each spoke represents a value axis for the variable it corresponds to. Each dataset is then drawn as a connected polygon, where the points of the polygon are arranged on the spokes according to their value. Each row of the dataset has a minimum and maximum column -- these values are used to determine the scale of the spoke for that variable, with the midpoint representing the desired value.
The intended use of radar plots is to display realtime information in such a way that outliers can be quickly identified. This can be an efficient way to convey if a process is running on-spec or off-spec at a glance.
The radar chart gets its data from a dataset. Each row in the dataset will become a single variable (spoke) on the chart. The dataset must have a columns labeled "Value", "Min", and "Max"; other columns will be ignored. To display realtime data on a radar chart, you can use a cell-update binding to bind individual values to tag values. You can also drop tags onto a radar chart, with the EngMin binding to min and EngMax binding to max. If there are no existing cell-update bindings, the tags will replace existing data, otherwise the tags will be added to the end of the dataset. Alternatively, you can have realtime information stored by a transaction group to a database table, and drive the radar chart's dataset with a query binding.
Refer to Radar Chart to learn more.
Properties
| Name | Description | Property Type | Scripting | Category |
|---|---|---|---|---|
| Actual Fill Color | Fill color for the actual polygon. Can be chosen from color wheel, chosen from color palette, or entered as RGB or HSL value. See Color Selector. | Color | .actualFillColor | Appearance |
| Actual Stroke Color | Stroke color for the actual polygon. See Color Selector. | Color | .actualStrokeColor | Appearance |
| Actual Stroke Width | Stroke width for the actual polygon. | float | .actualStrokeWidth | Appearance |
| Background Color | The background color of the component. See Color Selector. | Color | .background | Appearance |
| Border | The border surrounding this component. Options are No border, Etched (Lowered), Etched (Raised), Bevel (Lowered), Bevel (Raised), Bevel (Double), and Field Border. Note: The border is unaffected by rotation. Changed in 8.1.21 As of 8.1.21, the "Button Border" and "Other Border" options are removed. | Border | .border | Common |
| Border Inset | The amount of area that the chart should be inset from the component bounds. | double | .borderInset | Appearance |
| Cursor | The mouse cursor to use when hovering over this component. Options are: Default, Crosshair, Text, Wait, Hand, Move, SW Resize, or SE Resize. | int | .cursorCode | Common |
| Data | Contains the datapoints for the radar plot. Each row represents a spoke and point on the polygon. | Dataset | .data | Data |
| Desired Fill Color | Fill color for the desired polygon. See Color Selector. | Color | .desiredFillColor | Appearance |
| Desired Stroke Color | Stroke color for the desired polygon. See Color Selector. | Color | .desiredStrokeColor | Appearance |
| Desired Stroke Width | Stroke width for the desired polygon. | float | .desiredStrokeWidth | Appearance |
| Name | The name of this component. | String | .name | Common |
| Quality | The data quality code for any Tag bindings on this component. | QualityCode | .quality | Data |
| Show Desired Shape | Display the desired shape on the chart. | boolean | .showDesiredShape | Appearance |
| Spoke Color | The color to use for the chart's spokes and exterior ring. See Color Selector. | Color | .foreground | Appearance |
| Spoke Width | The line width for the chart's spokes and exterior ring. | float | .strokeWidth | Appearance |
| Styles | Contains the component's styles. | Dataset | .styles | Appearance |
| Visible | If disabled, the component will be hidden. | boolean | .visible | Common |
Scripting
Component Functions
This component does not have component functions associated with it.
Extension Functions
This component does not have extension functions associated with it.
Event Handlers
Event handlers allow you to run a script based off specific triggers. See the full list of available event handlers on the Component Events page
Customizers
Examples
Radar Charts display realtime information in such a way that outliers can be quickly identified. In this example, the Radar Chart plotted the values forming a polygon using the raw data in the code block below. You can quickly see where the process is out-of-spec and compare the values to where they should be.
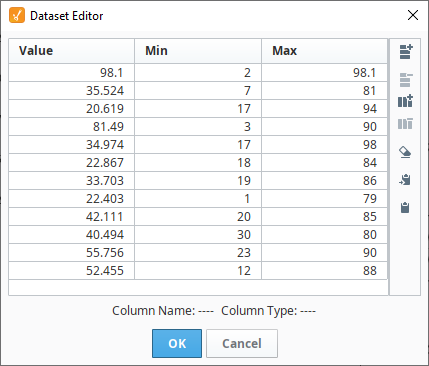
Radar Chart - Dataset Editor
"#TYPES"
"D","D","D"
"#ROWS","12"
"98.09962923575328","2.0","98.09962923575328"
"35.524092312648314","7.0","81.0"
"20.619468859704142","17.0","94.0"
"81.49014792489209","3.0","90.0"
"34.97383734960057","17.0","98.0"
"22.866686267453773","18.0","84.0"
"33.70266314329313","19.0","86.0"
"22.402620699908937","1.0","79.0"
"42.111234986669811","20.0","85.0"
"40.494873208734567","30.0","80.0"
"55.756456098723458","23.0","90.0"
"52.455123456944321","12.0","88.0"