Tag History Bindings in Perspective
Tag History Binding
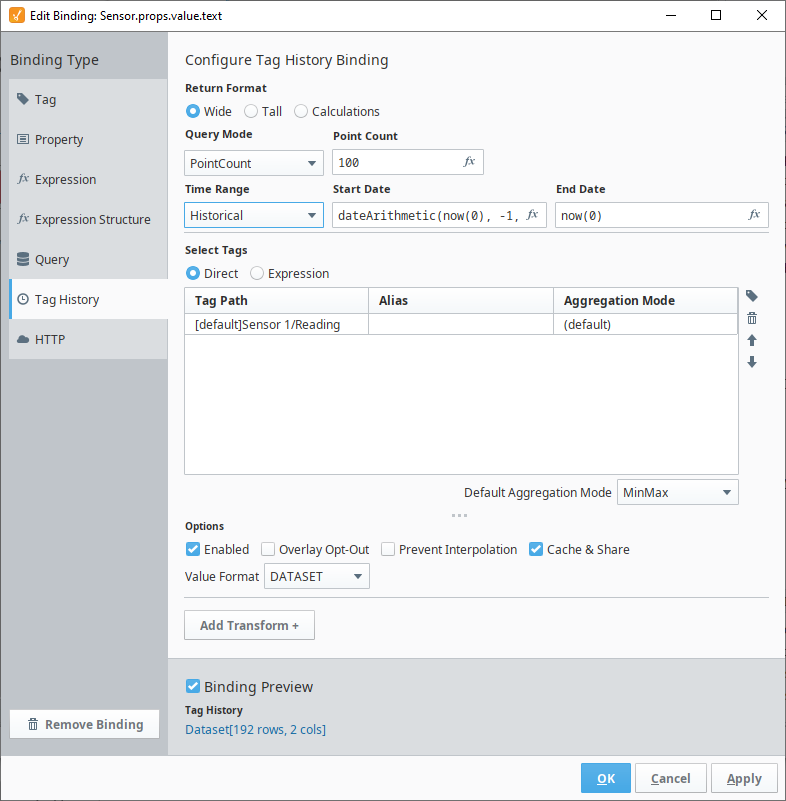
Tag History bindings allow you to pull Tag History data that is stored in the database into a component through a binding.
| Configuration Property | Description |
|---|---|
| Return Format | Allows you to select the return format of the data.
|
| Query Mode | How you want to query out the data.
|
| Time Range | The time range to pull data values from. See Time Range. |
| Select Tags | An area to select the tags to trend. Tag paths can be defined directly or using an expression. See Using Dynamic Tag Paths below about Expression mode. New in 8.1.13 Users may now browse for and select tags from both Realtime and Historical Tag Providers.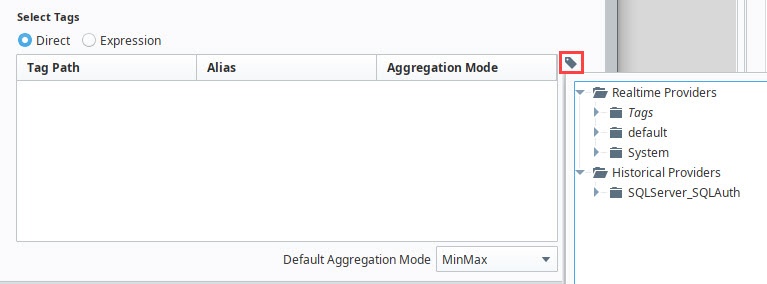 |
| Aggregation Mode | The aggregation mode that will be applied to each time slice, unless a more specific aggregation mode is defined on a tag path. For more information on how time slices are populated, see the How the Tag Historian System Works page. See Aggregation Mode. |
| Default Aggregation Mode | Aggregation mode to use as a default if the Select Tags are set to Default Aggregation mode. |
| Options | Allows you to specify various options that will apply to the binding. See Options. |
Time Range
| Property | Description |
|---|---|
| Realtime | The start date will go back as far from the current time as the Most Recent property specified and the end date will be the current time when the binding evaluates. Options are MS, SEC, MIN, HOUR, DAY, WEEK, MONTH, or YEAR. Polling: You can specify a Polling rate to determine how often to update the times. Click the Functions  |
| Historical | You can specify the Start and End Date in an expression. Click the Functions Caution: Please note that intervals returned by Historical queries are inclusive of the End Date, including when the End Date is set to now(). This means you may see one additional interval than expected that only contains future dates, which get interpolated to 0 and can cause trending issues. For example, if you want data from 10am - 11am in 1 minute windows, you’ll need to set your query from 10am-10:59am. Querying to 11am would create an interval to contain it and that window will often return 0 since there is typically no future value. Additionally, if you went on to add the results of two queries of adjoining times, such as 10am - 11am and 11am - 12pm, the first window of the second period would have duplicate data to the last window of the first period. |
Aggregation Mode
| Aggregation Mode | Description |
|---|---|
| (default) | Use the mode set in the Default Aggregation Mode field. |
| Average | The values are averaged together, weighted for the amount of time they cover within a time slice. |
| MinMax | The minimum and maximum values will be returned for the window. In other words, two rows will be returned. If only one value is seen in the time slice, only one row will be returned. |
| LastValue | The value closest to the ending time of the time slice will be returned. |
| SimpleAverage | The values are summed together and divided by the number of values. |
| Sum | The values in the time slice are summed together. |
| Minimum | The minimum value in the time slice. |
| Maximum | The maximum value in the time slice. |
| DurationOn | Returns the total time, in seconds, that the value was recorded as non-zero. |
| DurationOff | Returns the total time, in seconds, that the value recorded as zero. |
| CountOn | Returns the number of times the tag's value went from a zero value to non-zero. |
| CountOff | Returns the number of times the tag's value changed from a non-zero value to zero. |
| Count | Returns the number of times a value was recorded |
| Range | Returns the range between the highest and lowest value for the period. Changed in 8.1.17 Range mode will return "0" if the historical tag value remains static over the given Time Range. |
| Variance | Returns the variance of values. Similar in concept to standard deviation. Only good quality values are used when calculating. |
| StdDev | Returns the standard deviation of values, or how much spread is present in the data; low standard deviation shows the values are close to the mean, and high standard deviation shows that the data points are spread out over a large range of values. Only good quality values are used when calculating |
| PctGood | Time-weighted percentage of good values over the date range. |
| PctBad | Time-weighted percentage of bad values over the date range. |
Options
| Option | Description |
|---|---|
| Enabled | Enable these options. |
| Overlay Opt-Out | Opt out of displaying the Tag quality overlay. |
| Ignore Bad Quality | Only data with "good" quality will be loaded from the data source. |
| Prevent Interpolation | Requests that values not be interpolated, if the row would normally require it. Also instructs the system to not write result rows that would only contain interpolated values. In other words, if the raw data does not provide any new values for a certain window, that window will not be included in the result dataset. |
| Cache & Share | New in 8.1.12 When this setting is enabled, the binding will utilize a polling engine that is shared across all running Perspective sessions. The polling engine will poll once, cache the value, and deliver the results to all registered consumers. The cache persists for a period of time that matches the configured poll rate. If polling is off, the default cache duration is 250 milliseconds. This optimization is helpful for consolidating multiple identical polling tasks, particularly when you have many Perspective sessions running at once. Disabling this option will bypass the cache. |
| Value Format | Can be Dataset or Document. |
Tag History Binding Example
In this example, we'll use a Table component to show the records from some Tags that have Tag History enabled.
-
Drag a Table component onto a view. Select the Table component.
-
In the Property Editor, click on the Binding
 icon next to the data property. The Edit Binding screen is displayed.
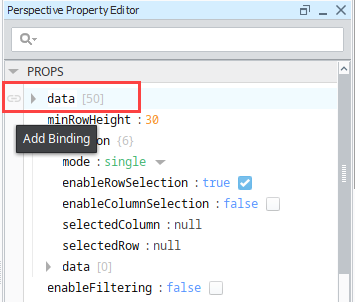
-
Select Tag History as the binding type.
-
In the Time Range section, select and the last 1 minute of data.
-
Under the Select Tags section, click on the Tag
 icon. Navigate to the first Tag and click OK. Repeat for additional Tags. In our example, we chose the Sine0 and Sine2 Tags.
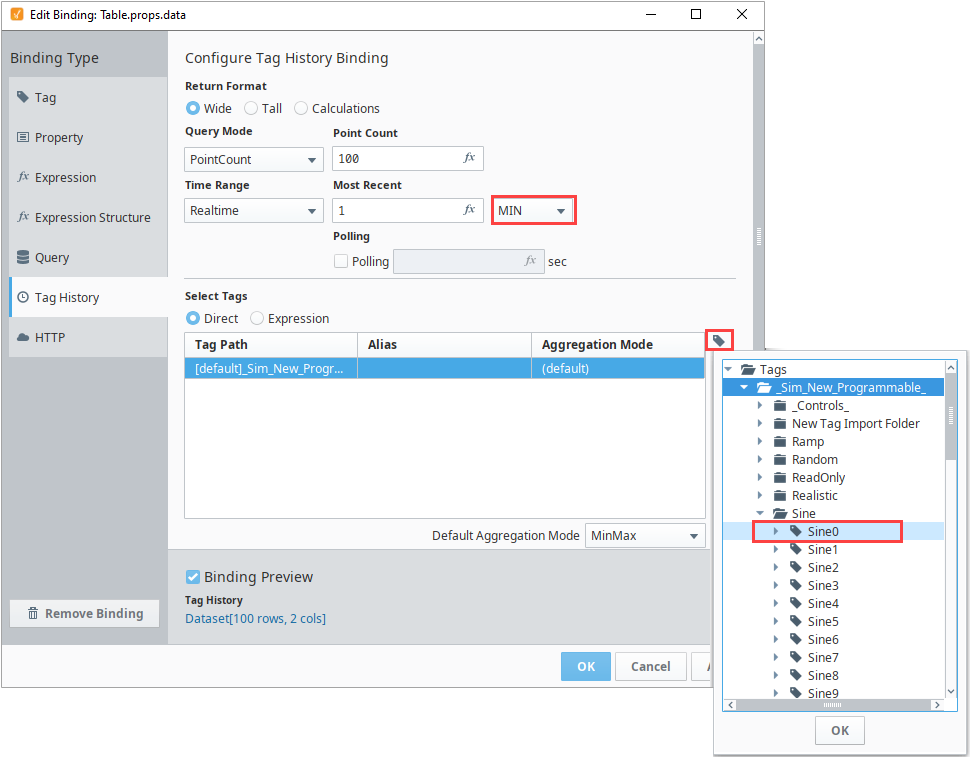
-
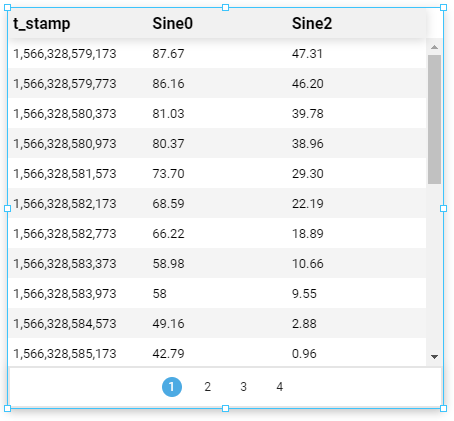
Notice the Binding Preview at the bottom of the screen. Click OK to save the Tag History binding.
-
Back in the view, the Table component now contains a column for the timestamp and one for each Tag. Notice how the timestamp does not have a date format.
-
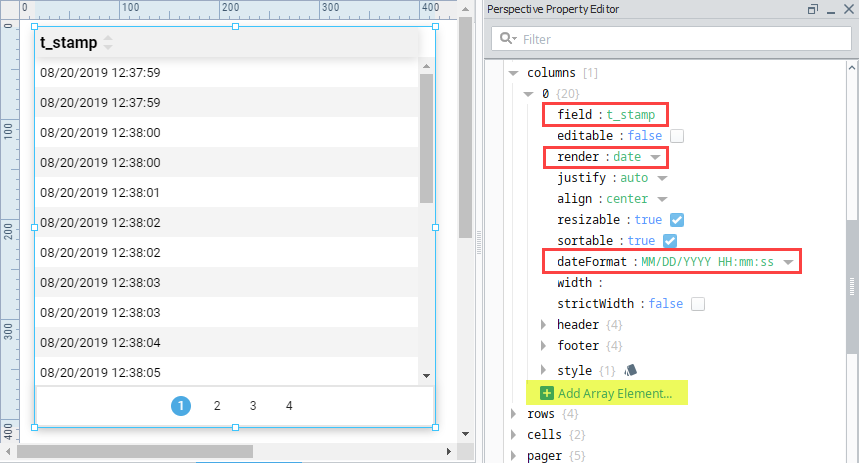
In order to change the t-stamp values into a date format, in the Property Editor under columns, click Add Array Element....

-
You'll notice that once the Array Element is added, the other two columns (Sine0 and Sine2) disappeared. We'll add them back in Step 10.
-
In the field property, enter t_stamp (which is the column name).
-
For the render property, select date from the dropdown.
-
Select a dateFormat from the dropdown. In this example, we used the date time format.
-
-
Now, let's add the Sine0 and Sine2 columns back into our table by clicking on Add Array Elements... 2 times (refer to the yellow highlights in the image above). There is no need to change any of the Sine0 or Sine2 column properties unless you want to change the default settings or rearrange columns.
Notice that columns 1 and 2 (Sine0 and Sine2, respectively) are collapsed in this image. To see all the columns properties, expand the columns.

Tag History Binding - Expression
Using Dynamic Tag Paths
Tag History bindings have the option to list out Tag paths, or to use an expression to build a Tag path. It is common to create a dynamic path or set of paths as a component property, that you then reference in other places. You can use as many Tag paths as you want, but they must all follow this format:
- key [array]
-
[0]
{object}- aggregate value
- alias value
- path value
-
[1]
{object}- aggregate value
- alias value
- path value
-
...
-
The aggregate in your nested Tag History object is optional. If not specified, it will use the default mode for direct Tag History bindings and use the aggregation mode set for the overall binding.
For an example, you can create a custom property on a chart and use it to fuel the historical data.
-
Create a custom property named Key on a chart component that is an Array type.
-
Copy and paste the JSON below into this Key property.
JSON for Key Array[
{
"aggregate": "Average",
"alias": "tank_temp",
"path": "[default]Tank/03/Temperature"
},
{
"aggregate": "Average",
"alias": "setpoint",
"path": "[default]Tank/03/Setpoint"
}
] -
Open the property binding on your chart and select the Tag History binding type.
-
Select the Expression radio button to create your own tag structure.
-
Click on the property selector button on the right and find your new custom property.
-
Click OK in the lower right.