Extension Functions
What Are Extension Functions
Extension Functions are found on the component scripting window of certain components, and they allow for more advanced customization of the component using scripting. These functions are generally more advanced and require a better understanding of Python. Unlike Event Handlers, Extension Functions are not driven by a specific event, but are instead called by the component itself for a specific purpose when appropriate. This may be when the component first loads in the window, or whenever the function receives new input.
From an object-oriented point of view, Extension Functions create a custom "subclass" of the base component type. Your subclass can then override and implement parts of the functionality of the component itself, in Python. Following Python object-oriented methodology, each extension function's first argument is called self . That is because these are methods that belong to the component's class itself, instance methods. The value of self will always be the component itself. Notice that this is different than Event Handler scripts where you are given an event object in your scope and the component that fired the event is under event.source . When you write an Extension Function, there is no event object so the component is given to you as the self object instead.
Each component Extension Function comes with its own documentation built-into the function's default implementation using a standard Python "doc-string". You will find that you are unable to edit the function's signature or docstring. Changing the method's signature (arguments or function name) would prevent the component from calling it correctly. Changing the docstring could be misleading or confusing as you'd lose the documentation for how your implementation of the function should work.
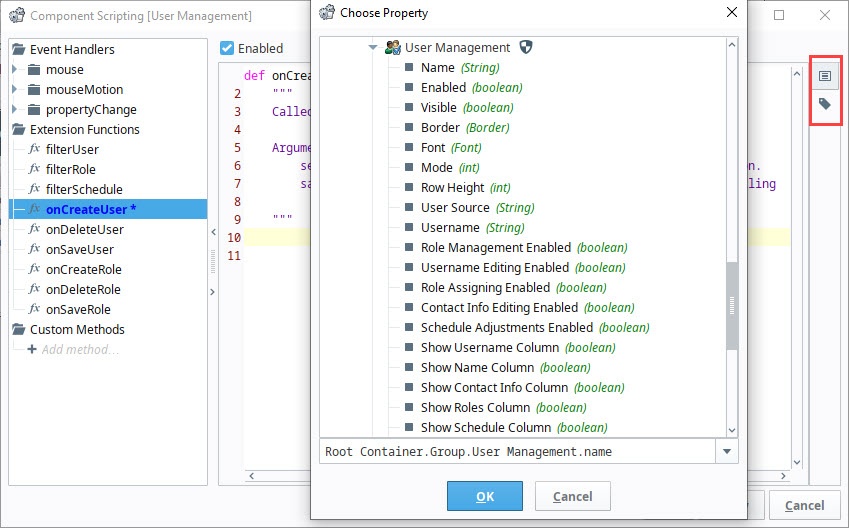
The Extension Function Script Builder now includes Insert Tag ![]() and Insert Property Reference
and Insert Property Reference ![]() helper buttons that allow you to easily insert correctly formatted references within your scripts.
helper buttons that allow you to easily insert correctly formatted references within your scripts.
Using Extension Functions
Using an Extension Function works much like using an Event Handler. First select and Enable the Extension Function within the component scripting window, and then add in a script. The script will then automatically run when called.
When indenting in an Extension Function, you must use tabs for indentation. Extension functions are "pre-written" using tab indentation, so any lines added must also use tab indentation.
Example - User Management Component
The User Management component has many Extension Functions that provide a way to customize how the component works. The filterUser() extension function is useful for filtering out users you don't want to see in the user source, preventing users from editing that user in the client. We can add a simple script to the filterUser() Extension Function that will hide the user from the list if they have the Administrator role.
-
Drag a User Management component in to your Designer workspace, and right-click on Scripting.
-
Under the Extension Functions folder select filterUser and click Enabled.
-
Copy the code from the code block below and add it to bottom of the script and click OK.
# Check to see if the user has the Administrator role.
if "Administrator" in user.getRoles():
    # Return 0 to hide them if they do.
    return 0
else:
    # Otherwise, show the user in the table.
    return 1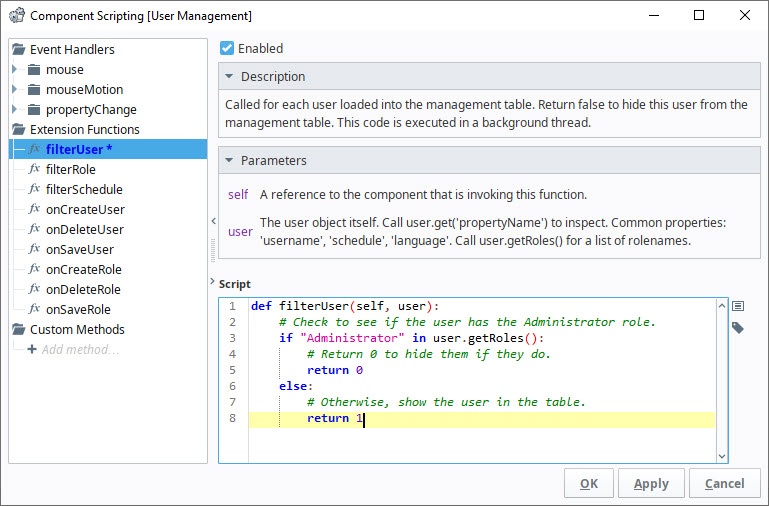
-
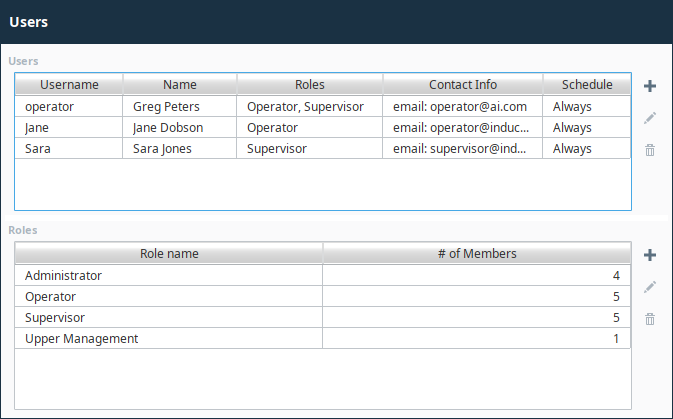
By enabling this script, we now only see the users without the Administrator role in the list of users.
Example - Table Component
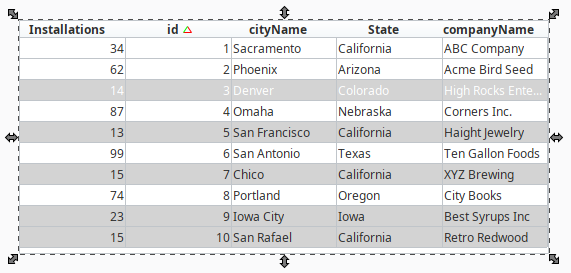
The Table component exposes an Extension Function called getBackgroundAt(). By implementing this function, you can control the background color of each cell of the table component using scripting. Starting with a Table component with some test data, then add the following script to the getBackgroundAt() Extension Function.
Here is our sample data. We want to have a clearer indication of what companies have fewer than 30 installations. So, we'll write a script to make those rows have a light grey background color.
| Installations | id | cityName | State | companyName |
|---|---|---|---|---|
| 34 | 1 | Sacramento | California | ABC Company |
| 62 | 2 | Phoenix | Arizona | Acme Bird Seed |
| 14 | 3 | Denver | Colorado | High Rocks Enterprises |
| 87 | 4 | Omaha | Nebraska | Corners Inc. |
| 13 | 5 | San Francisco | California | Haight Jewelry |
| 99 | 6 | San Antonio | Texas | Ten Gallon Foods |
| 15 | 7 | Chico | California | XYZ Brewing |
| 74 | 8 | Portland | Oregon | City Book |
| 23 | 9 | Iowa City | Iowa | Best Syrups Inc |
| 15 | 10 | San Rafael | California | Retro Redwoods |
-
Right-click on the Table component and choose Scripting.
-
Choose the
getBackgroundAt*extension function. -
Select the Enabled check box.
-
Copy the code from the code block below and add it to bottom of the script and click OK.
Python - Table Row Color# For each cell, we check the value of the cell in the same row but in Installations.
if self.data.getValueAt(row, "Installations") < 30:
# If the value is less than 30, we return a light grey color.
return system.gui.color("lightgrey")
else:
# Otherwise, we return a white color.
return system.gui.color("white") -
We should see the script run automatically, and the background color of the table will change.
Example - Power Table Component
The Power Table component has several extension functions on it that change the way the table looks or behaves. One in particular, called onPopupTrigger(), makes it easy to implement a right-click popup menu as it is called each time a user right-clicks on a cell of the table. It can be used in conjunction with the system.gui.createPopupMenu function to create your own custom popup menu, as shown in the following example.
-
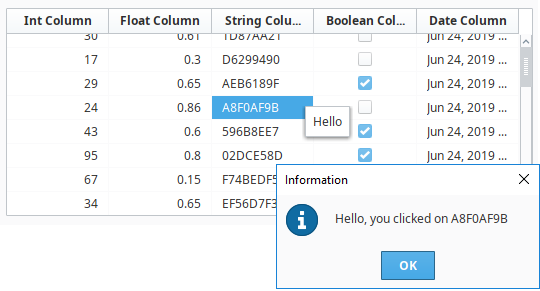
Drag a Power Table component on to your Designer workspace and set the Test Data property to 'true' so you have some data to test on.
-
With the Power Table selected, click Scripting, and then click on the onPopupTrigger extension function.
-
Select the Enabled checkbox.
-
The onPopupTrigger extension function will have a pre-built example commented out in the extension function. Uncomment the lines of code to see it in action.
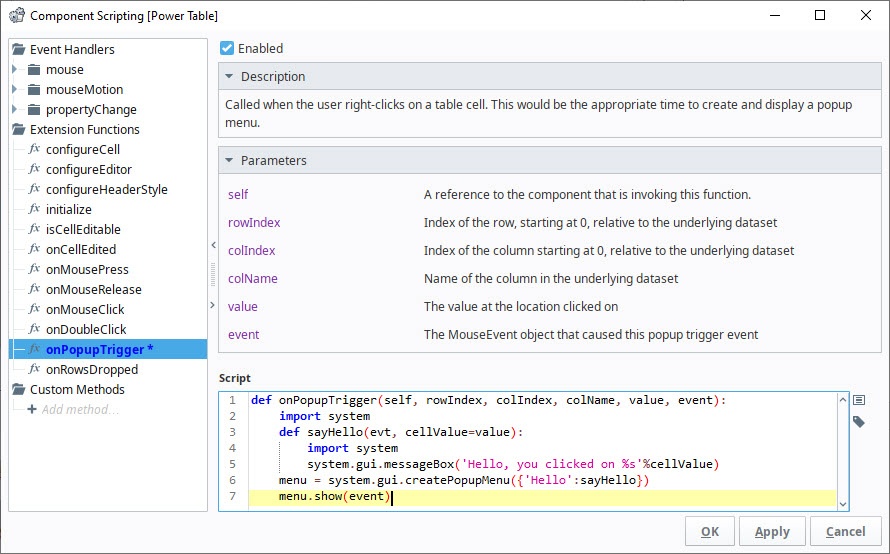 Python - Power Table Popup Trigger
def sayHello(evt, cellValue=value):
    system.gui.messageBox('Hello, you clicked on %s'%cellValue)
menu = system.gui.createPopupMenu({'Hello':sayHello})
menu.show(event) -
Right-click on a cell in the table and a "Hello" menu option will have a message box appear that has the value of the cell that was right-clicked.
Example - Ad Hoc Charting
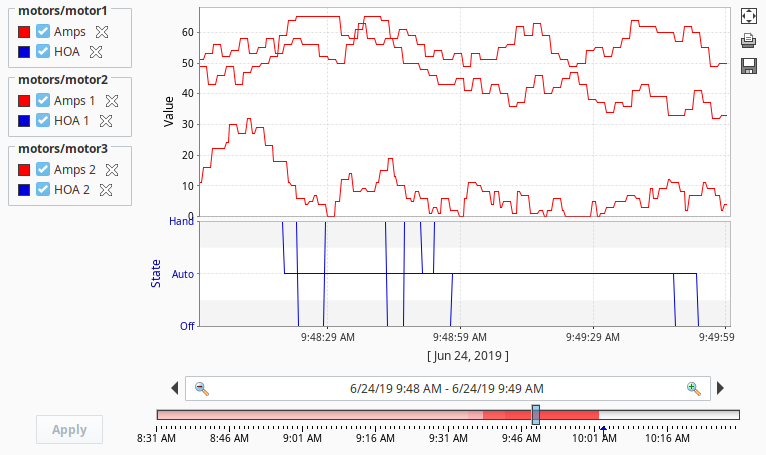
The Easy Chart component has an Extension Function to allow scripting when a Tag is dropped onto it (see Using the Tag Browse Tree for Charting). There is a lot of customization possible in the Designer, but any client side changes to the Tag Pens dataset must be done here. Generally, people want to change what axis and subplot a pen goes into based on some other information. Below is a simple example that uses the Tag's name to determine this. For this example to work, you need to have two subplots and a second axis named "HOA".
# Alter chart configuration when dropping pens
# sample data for the Tag Pens property:
#"NAME","TAG_PATH","AGGREGATION_MODE","AXIS","SUBPLOT","ENABLED","COLOR","DASH_PATTERN","RENDER_STYLE","LINE_WEIGHT","SHAPE","FILL_SHAPE","LABELS","GROUP_NAME","DIGITAL","OVERRIDE_AUTOCOLOR","HIDDEN","USER_SELECTABLE","SORT_ORDER","USER_REMOVABLE"
#"HOA","[~]Motors/Motor 1/HOA","MinMax","HOA","2","true","color(85,255,85,255)","","1","1.0","0","true","false","","false","false","false","true",,"true"

# get old pen data and append new info
oldData = system.dataset.toPyDataSet(self.tagPens)
# get new info
for fullTagPath in paths:
    # get names for everything in the tag path
    lastSlashIndex = fullTagPath.rfind("/")
    closeBracketIndex = fullTagPath.find("]")
    tagName = fullTagPath[lastSlashIndex+1:]
    tagPath = fullTagPath[closeBracketIndex+1:]
    groupName = fullTagPath[closeBracketIndex+1:lastSlashIndex]

    # find which tags are named "hoa" and put them in the HOA subplot.
    if tagName.lower() == "hoa":
        axis = "HOA"
        subplot = 2
        color = "color(255,85,85,255)" #red
        digital = "true"
    else:
        axis = "Default Axis"
        subplot = 1
        color = "color(85,85,255,255)" #blue
        digital = "false"

    # append to the old pen data
    newData = system.dataset.addRow(oldData, [tagName,tagPath,"MinMax",axis,subplot,"true",color,"","1","1.0","0","true","false",groupName,digital,"false","false","true","","true"])

# push new pens back to the tagPens property
self.tagPens = newData