Tag Diagnostics
In 8.1.34, the Tag Diagnostics popup window was added to maintain quick access to relevant tag information and introduce the Tag Reference Tracker. Note that with this change the Tag Editor no longer displays tag diagnostics information. Pages detailing features of the previous Tag Editor can be found in Deprecated Ignition Features.
Accessing the Tag Diagnostics Window
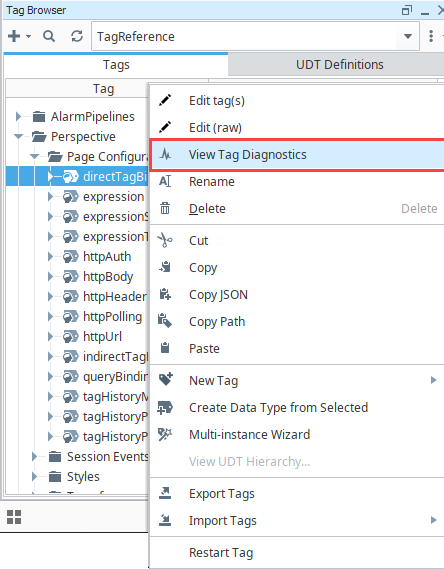
To access Tag Diagnostics for a specified tag, right-click on the tag in the Tag Browser and select View Tag Diagnostics. This will open the Tag Diagnostics window, which contains a Diagnostics, Active Subscriptions, and Reference Logs tabs.
Tag Diagnostic Values
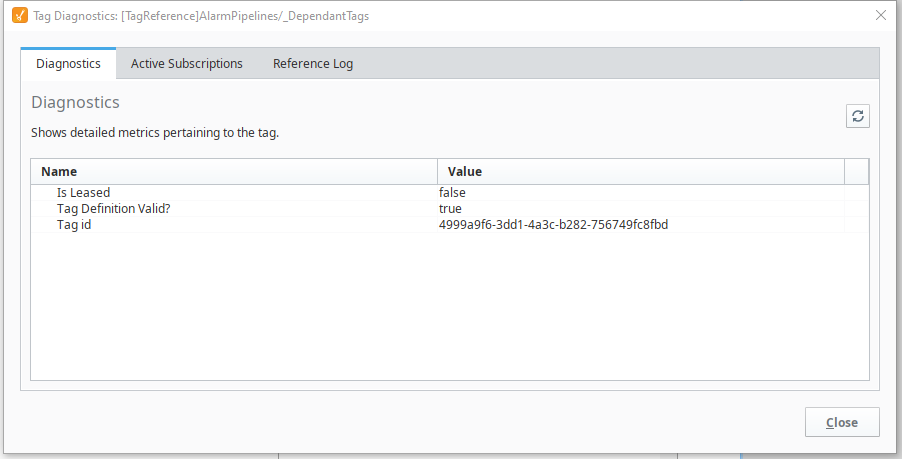
The Diagnostics tab provides detailed metrics about the specified tag including:
- Current value, quality and timestamp information
- Error messages
- Status of dependent datasources
The diagnostic values do not update while the Tag Diagnostics window is open. The displayed information is collected when opened and will remain static until the window is closed and opened again.
A Refresh ![]() icon has been added to the Diagnostics tab to update the displayed information while the window is still opened.
icon has been added to the Diagnostics tab to update the displayed information while the window is still opened.
| Name | Description |
|---|---|
| Alarm* | A subcategory for details pertaining to alarms configured on the tag. Each alarm on a tag will receive its own subcategory, containing the following items:
|
| Deadband | A subcategory for details pertaining to the deadband settings on the tag. These metrics are only available when the Numeric category's Deadband is set to a value larger than 0. Contains the following:
|
| History | A subcategory for details pertaining to the history settings on the tag.
|
| OPC | A subcategory for details pertaining to OPC details on the tag. These diagnostic values are only available when (Value Source) is set to OPC.
|
| Alarm Acknowledged | Displays any errors from the Alarm Acknowledged tag event script. Only visible if a script is defined on the corresponding tag event. |
| Alarm Active | Displays any errors from the Alarm Active tag event script. Only visible if a script is defined on the corresponding tag event. |
| Alarm Cleared | Displays any errors from the Alarm Cleared tag event script. Only visible if a script is defined on the corresponding tag event. |
| Datasource Status | States which datasource is configured for the tag. Only available when Value Source is set to Query. |
| Is Leased | If true, indicates that the tag is using a leased tag group, and is currently executing at the leased rate. |
| Is Scaled | If true, indicates that Scale Mode has been enabled. |
| Last published value | Represents the last value on the tag when the diagnostics tab was last updated. |
| Range | New in 8.1.11 When Deadband Mode is set to Percent, indicates the range of values between the Engineering Low Limit and Engineering High Limit. |
| Quality Changed | Displays any errors from the Quality Changed tag event script. Only visible if a script is defined on the corresponding tag event. |
| Quality Diagnostics | Reports any quality errors about the tag. This is typically only present when there is a configuration issue with the tag, such as when Value Source is set to Query and a Datasource value has not been set. |
| Tag Definition Valid? | A flag that indicates whether or not a tag configuration is valid. |
| Tag id | A unique identifier for the tag. Used by the tag system to distinguish one tag from another. |
| Value Changed | Displays any errors from the Value Changed tag event script. Only visible if a script is defined on the corresponding tag event. |
Analog Deadband Values
The following metrics appear under the Deadband (Analog) category.
| Name | Description |
|---|---|
| Current Lower Slope and Current Upper Slope | These properties represent the slope for each window. These values are calculated every time the tag evaluates, based upon the tag's sample mode. The resulting numbers are then compared to these current slopes. If the new upper slope is less than the Current Lower Slope, or the new lower slope exceeds the Current Upper Slope, then the new value is stored. In either case, the new slope values replace the value on these Current Slope properties. See Deadband and Analog Compression for more information. |
| Last Stored Time | Represents the previously stored timestamp, after the most recent timestamp. Works in a similar manner to Last Stored Value except this stores the time of the storage, instead of the value. |
| Last Stored Value | Represents the value stored before the most recently stored value. For example, say a historian system stores the following for a single tag, in order:
|
| Last value | Represents the last QualifiedValue on the tag, regardless of whether or not that value was stored. In other words, the value most recently written to the tag. |
| Mode | The Historic category's Deadband Style used by the tag. Useful in cases where a style of "Auto" is used, as this diagnostic metric will display which option was selected by the system. |
| Tolerance | The tolerance used to calculate each new slope. The value of this metric is determined by the History category's Deadband setting on the tag. |
Active Subscriptions
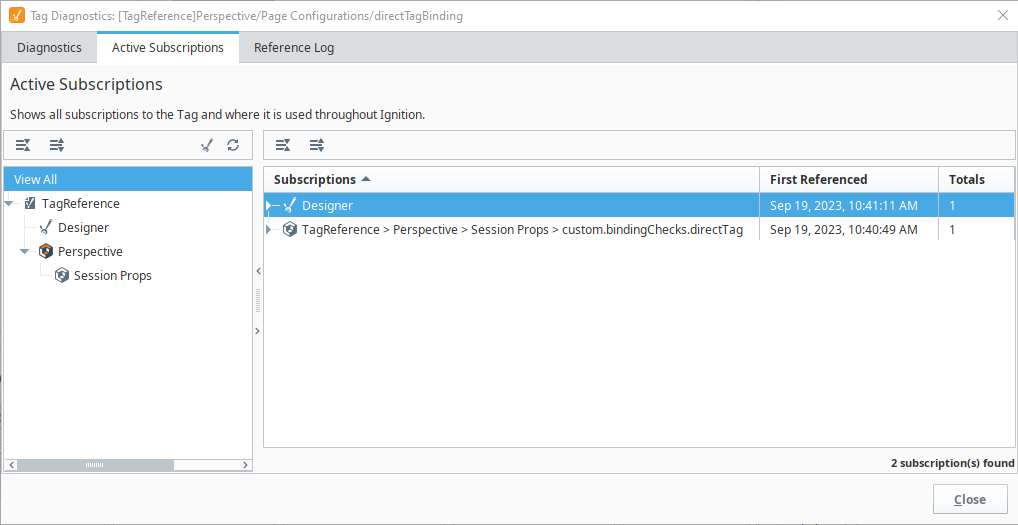
The Active Subscriptions tab displays real-time tracking of a tag subscription by sharing the following information:
- Subscriptions: Displays the path to a resource that is currently subscribed to the selected tag.
- First Referenced: Displays the first logged time a tag subscription at the given location was created. The logged time is reflective of the first subscription for the current grouping of a specific subscription.
- Totals: Displays the number of currently active subscriptions from the referenced location. For example, if there are multiple Perspective Sessions with the same View bound to the selected tag loaded, this number would increase.
Additionally, the Reference Browser on the left-hand side lists all locations where the tag has an active subscription. Use the Collapse All ![]() and Expand All
and Expand All ![]() icons to adjust how much information is displayed. You can also update the active subscription information by clicking the Refresh
icons to adjust how much information is displayed. You can also update the active subscription information by clicking the Refresh ![]() icon. The Designer
icon. The Designer ![]() icon is available to show/hide references to the specified tag from the Designer, including in the tag browser and Vision components when in Preview mode.
icon is available to show/hide references to the specified tag from the Designer, including in the tag browser and Vision components when in Preview mode.
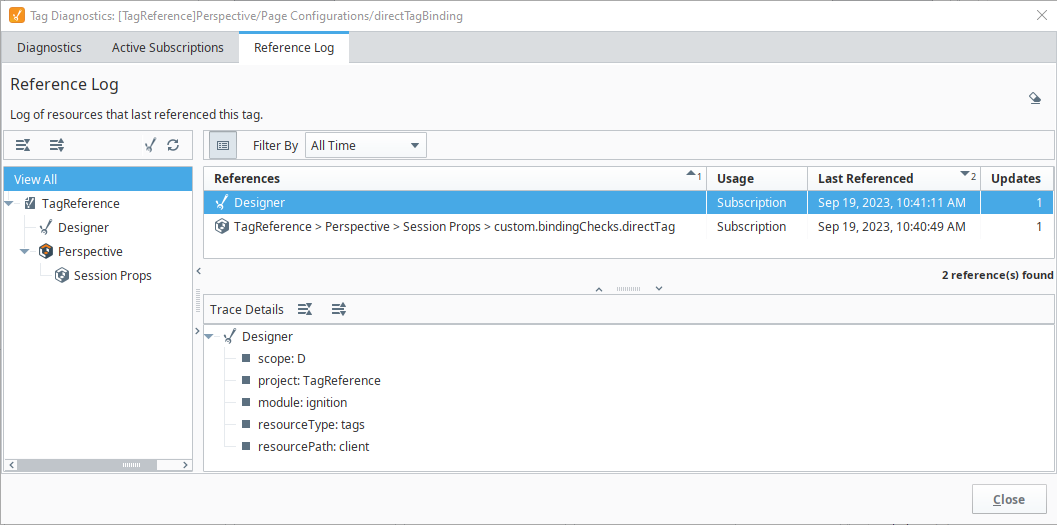
Tag Reference Tracker
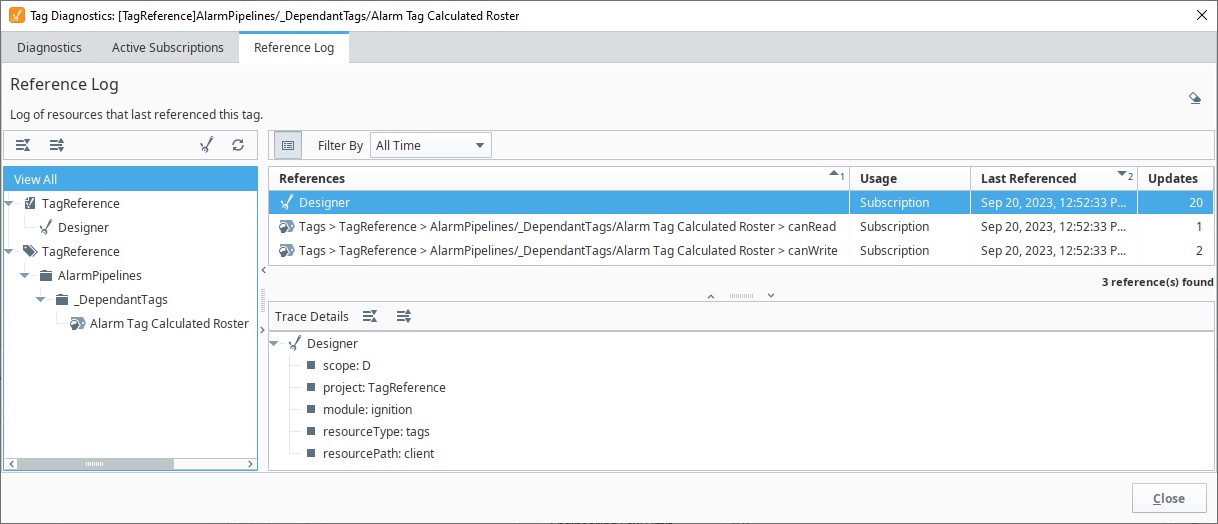
The Reference Log tab shows the data stored in the Tag Reference Tracker Store as a way to find where tags are being used in a project. The Tag Reference Tracker Store provides visibility to the areas that rely on any given tag as it displays what resources have subscribed, read, written to or configured specified tags.
The Reference Log can only show references that are in use or have been in use since the reference tracking began. It will miss potential references that haven't been active since tracking started. The longer is it in use, the more reliable the tracker becomes as the history will grow and continue to log with each new session that is opened.
The bulk of the Tag Reference Tracker information includes:
- References: The tag path to display where the tag was used.
- Usage: The type of reference to this tag. The usage type listed will match the tracking type recorded in the Ignition database file. The four tracking types for tag usage include reads, writes, subscriptions, and configuration changes.
- Configuration: Resource made a configuration change to the tag definition.
- Subscription: Resource subscribed to the tag to display information on a particular property.
- Read: A read event occurred to a property on the tag.
- Write: A write event occurred to a property on the tag.
- Last Referenced: The timestamp for when the reference was last updated.
- Updates: The number of times a reference with a specific usage type occurred.
Double-clicking on a reference line will open the tag reference root location or the Tag Editor depending on the reference type. If it is in a Tag Value Change Script or an Expression used within the Tag definition, it will open the Tag Editor.
Like the Active Subscriptions tab, the Reference Browser on the left-hand side will show where the tag is used in any project. You can use the reference tree or Collapse All ![]() and Expand All
and Expand All ![]() icons to locate where in the Designer a tag is used for each project, the Designer
icons to locate where in the Designer a tag is used for each project, the Designer ![]() icon to show/hide Designer references, and the Refresh
icon to show/hide Designer references, and the Refresh ![]() icon to refresh the browser list. Refer to the Trace Details section at the bottom for more information that might be helpful in understanding tag usage. Raw tracking logs can also be found by right-clicking on the Reference Log tab and selecting Show Raw. The Raw Tag Logs Browser will now be visible on the Tag Diagnostics window. Clicking the Export
icon to refresh the browser list. Refer to the Trace Details section at the bottom for more information that might be helpful in understanding tag usage. Raw tracking logs can also be found by right-clicking on the Reference Log tab and selecting Show Raw. The Raw Tag Logs Browser will now be visible on the Tag Diagnostics window. Clicking the Export ![]() icon to download the raw logs.
icon to download the raw logs.
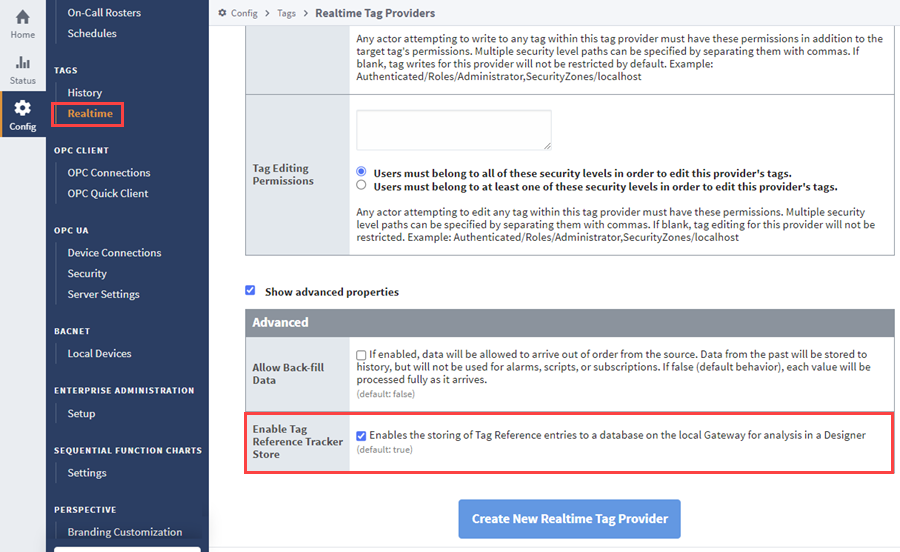
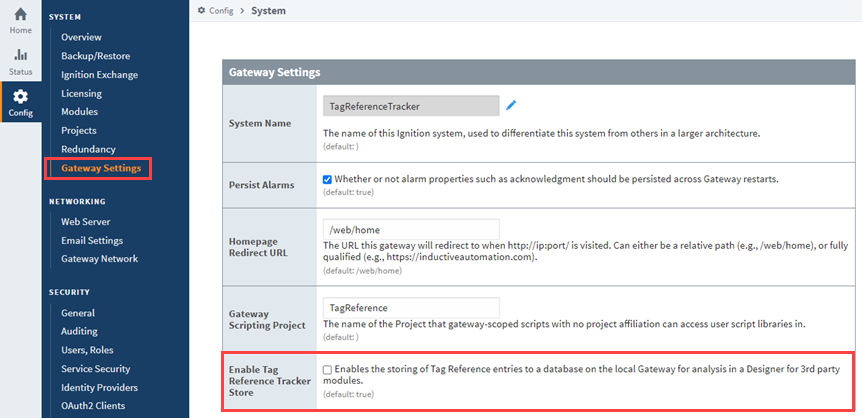
Enabling/Disabling the Tag Reference Store
The Tag Reference Store is enabled by default on new installations and disabled by default on upgrades from Ignition versions 8.1.33 and earlier. There are two options to enable or disable the Tag Reference Store depending on the provider type.
- For Realtime Tag Providers, standard and remote: Navigate to the Config > Tags > Realtime on the Gateway to access the Realtime Tag Providers page. Select edit for the provider you want to enable/disable and expand the Show advanced properties section. If the Enable Tag Reference Tracker Store property is checked, it is enabled.
- For managed providers, like third party modules and the system provider: Navigate to the Config > System > Gateway Settings on the Gateway to access the System Settings page. If the Enable Tag Reference Tracker Store property is checked, it is enabled. Be prepared that this setting impacts all managed providers throughout the Gateway, so a large number of third party modules can result in large data collections.
Disabling the Tag Reference Tracker will not impact the Diagnostics or Active Subscriptions tabs, but the Reference Log will no longer track tag information.
Collecting Data Backups
Gateway backups do not include Tag Reference Store data. This information is saved instead in a database that creates a new Diagnostics folder within the Data directory of an Ignition installation. Make sure to collect and add the reference data from this folder to any backups so no information is lost.
The default folder location for each operating system are listed below:
Windows
C:\Program Files\Inductive Automation\Ignition\data\diagnostics\tags
MacOS
/usr/local/ignition/data/diagnostics/tags
Linux
/usr/local/bin/ignition/data/diagnostics/tags