Perspective - Adding GeoJSON Shapes
In this example we'll demonstrate how to add geoJSON features to the Map component.
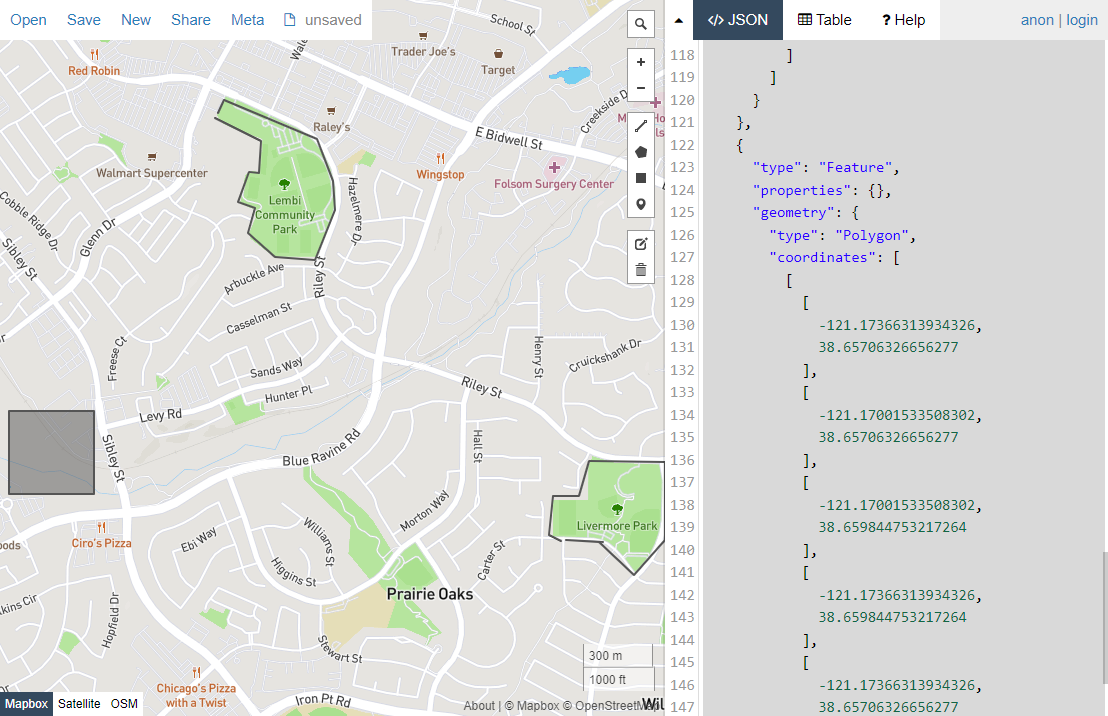
Acquiring GeoJSON Data
The first step involves acquiring some data. Instead of writing this by hand we can use https://geojson.io/ to quickly draw a few features. In a real world scenario this data would likely be provided by an external endpoint, or harvested from something like data.gov and hosted internally. For this example we're going to generate the geoJSON data, then create a Web Dev resource to store the data.
The code block below contains the data we'll use for this example.
{
  "type": "FeatureCollection",
  "features": [
    {
      "type": "Feature",
      "properties": {},
      "geometry": {
        "type": "LineString",
        "coordinates": [
          [
            -121.14997386932373,
            38.655488159953
          ],
          [
            -121.15048885345459,
            38.655689239321134
          ],
          [
            -121.15031719207764,
            38.65699624145518
          ],
          [
            -121.14920139312744,
            38.65699624145518
          ],
          [
            -121.14877223968504,
            38.65816917178303
          ],
          [
            -121.14551067352294,
            38.658135659754485
          ],
          [
            -121.14551067352294,
            38.655521673220235
          ],
          [
            -121.14684104919432,
            38.65434869953815
          ],
          [
            -121.14834308624268,
            38.6554546466701
          ],
          [
            -121.14975929260254,
            38.655521673220235
          ],
          [
            -121.14817142486571,
            38.6554546466701
          ]
        ]
      }
    },
    {
      "type": "Feature",
      "properties": {

      },
      "geometry": {
        "type": "LineString",
        "coordinates": [
          [
            -121.16469383239745,
            38.66983040550309
          ],
          [
            -121.16443634033203,
            38.670265989507826
          ],
          [
            -121.16044521331787,
            38.66895922954322
          ],
          [
            -121.15975856781006,
            38.66755192290758
          ],
          [
            -121.15967273712158,
            38.666580195039295
          ],
          [
            -121.16053104400635,
            38.66490477119321
          ],
          [
            -121.16224765777588,
            38.665005297729465
          ],
          [
            -121.16340637207033,
            38.66580950493899
          ],
          [
            -121.16310596466064,
            38.66664721117775
          ],
          [
            -121.16383552551268,
            38.66684825921672
          ],
          [
            -121.16336345672606,
            38.66785349094385
          ],
          [
            -121.16293430328369,
            38.66781998344699
          ],
          [
            -121.16284847259521,
            38.66889221556877
          ],
          [
            -121.16482257843018,
            38.669662872487926
          ]
        ]
      }
    },
    {
      "type": "Feature",
      "properties": {},
      "geometry": {
        "type": "Polygon",
        "coordinates": [
          [
            [
              -121.17366313934326,
              38.65706326656277
            ],
            [
              -121.17001533508302,
              38.65706326656277
            ],
            [
              -121.17001533508302,
              38.659844753217264
            ],
            [
              -121.17366313934326,
              38.659844753217264
            ],
            [
              -121.17366313934326,
              38.65706326656277
            ]
          ]
        ]
      }
    }
  ]
}
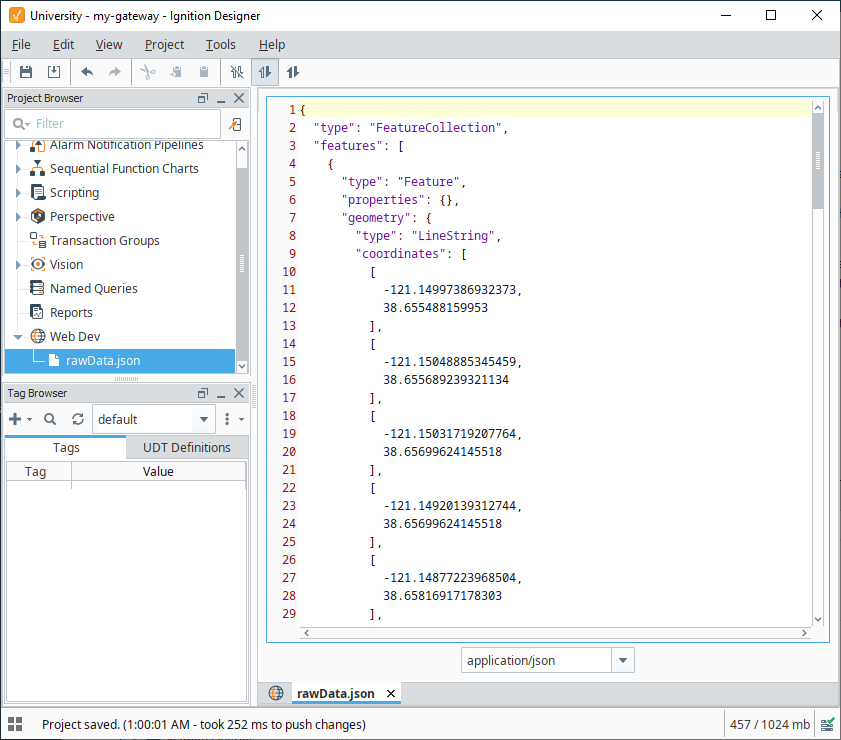
Store the Data
Next we can store the data as a Web Dev resource. If your data is being provided by an existing endpoint, then skip this section.
- In the Designer's Project Browser, navigate to the Web Dev section and create a new Text Resource. Name this resource rawData.json.
- At the bottom of the workspace, change the dropdown to application/json.
- Paste your geoJSON data into the text resource.
- Save the Project.
Pass the Data to the Map
Now that we have some data we can hand it off to our map component. We'll use a HTTP binding.
-
In the Designer, navigate to, or create, a Perspective view.
-
On the view, create a Map component.
-
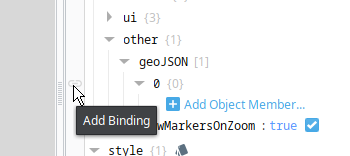
With the Map selected, locate the props.layers.other.geoJSON property. Click the Add Array Element button, which adds a "0" member.
-
Configure a binding on the "0" member.
-
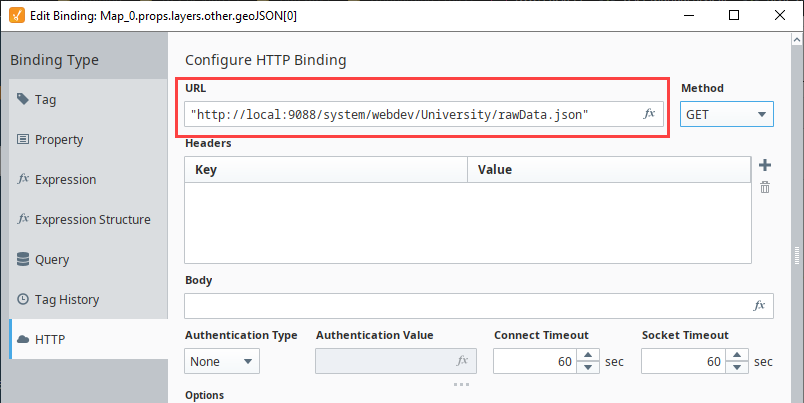
Select HTTP as the binding type.
-
For the URL property, enter the endpoint housing your data. If you're using a Web Dev resource as demonstrated earlier on this page then you can copy the mounted path from the Project Browser, but make sure to use a full URL by adding in "http://" or "https://".
-
After pasting the URL, place quotation marks on both sides of the URL, as the field expects a valid expression.
-
Click OK to close the binding window.
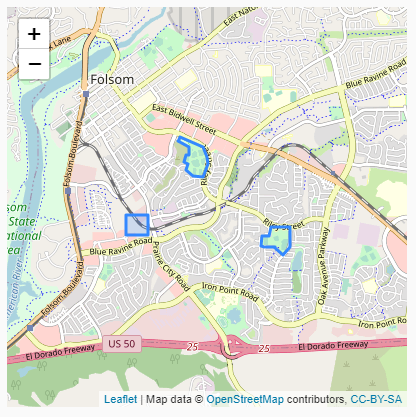
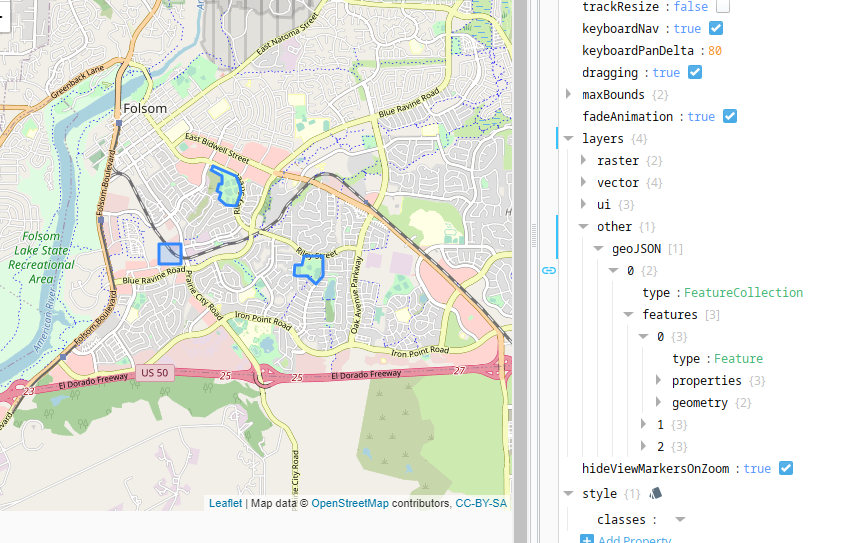
Now we have some features on our map that are driven by our geoJSON data.
Modify the Incoming Data
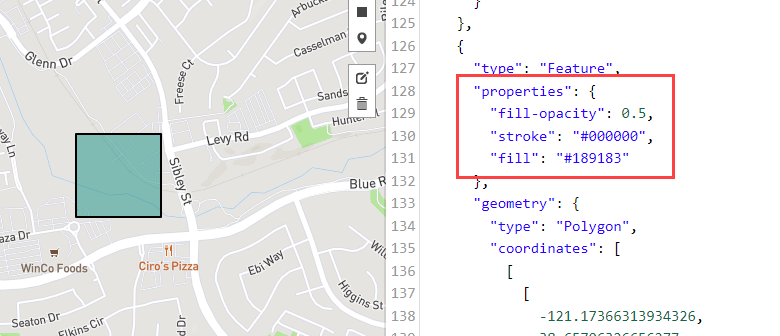
Our Map is now showing features. In a real world scenario you may need to modify the incoming data so that it is formatted in a way that the map component expects. For example, the geojson.io tool allows you to define colors for the strokes and fill on each feature. However, it defines these features under a "properties" object, which our Map component cannot utilize since it is expecting any styling attributes to be listed under a "styleOptions" object.
For this next example, we will demonstrate how to modify incoming data with a script transform. This example will focus on styling attributes, but could be expanded to account for other arbitrary geoJSON property data.
Update our GeoJSON Data
The code block below contains the new geoJSON data this example will use. Copy the contents of the code block, and paste them into our Web Dev text resource. Save the project after pasting.
{
  "type": "FeatureCollection",
  "features": [
    {
      "type": "Feature",
      "properties": {
        "stroke": "#c7170a"
      },
      "geometry": {
        "type": "LineString",
        "coordinates": [
          [
            -121.14997386932373,
            38.655488159953
          ],
          [
            -121.15048885345459,
            38.655689239321134
          ],
          [
            -121.15031719207764,
            38.65699624145518
          ],
          [
            -121.14920139312744,
            38.65699624145518
          ],
          [
            -121.14877223968504,
            38.65816917178303
          ],
          [
            -121.14551067352294,
            38.658135659754485
          ],
          [
            -121.14551067352294,
            38.655521673220235
          ],
          [
            -121.14684104919432,
            38.65434869953815
          ],
          [
            -121.14834308624268,
            38.6554546466701
          ],
          [
            -121.14975929260254,
            38.655521673220235
          ],
          [
            -121.14817142486571,
            38.6554546466701
          ]
        ]
      }
    },
    {
      "type": "Feature",
      "properties": {
        "stroke": "#0f3df5"
      },
      "geometry": {
        "type": "LineString",
        "coordinates": [
          [
            -121.16469383239745,
            38.66983040550309
          ],
          [
            -121.16443634033203,
            38.670265989507826
          ],
          [
            -121.16044521331787,
            38.66895922954322
          ],
          [
            -121.15975856781006,
            38.66755192290758
          ],
          [
            -121.15967273712158,
            38.666580195039295
          ],
          [
            -121.16053104400635,
            38.66490477119321
          ],
          [
            -121.16224765777588,
            38.665005297729465
          ],
          [
            -121.16340637207033,
            38.66580950493899
          ],
          [
            -121.16310596466064,
            38.66664721117775
          ],
          [
            -121.16383552551268,
            38.66684825921672
          ],
          [
            -121.16336345672606,
            38.66785349094385
          ],
          [
            -121.16293430328369,
            38.66781998344699
          ],
          [
            -121.16284847259521,
            38.66889221556877
          ],
          [
            -121.16482257843018,
            38.669662872487926
          ]
        ]
      }
    },
    {
      "type": "Feature",
      "properties": {
        "fill-opacity": 0.5,
        "stroke": "#000000",
        "fill": "#189183"
      },
      "geometry": {
        "type": "Polygon",
        "coordinates": [
          [
            [
              -121.17366313934326,
              38.65706326656277
            ],
            [
              -121.17001533508302,
              38.65706326656277
            ],
            [
              -121.17001533508302,
              38.659844753217264
            ],
            [
              -121.17366313934326,
              38.659844753217264
            ],
            [
              -121.17366313934326,
              38.65706326656277
            ]
          ]
        ]
      }
    }
  ]
}
Update our Binding
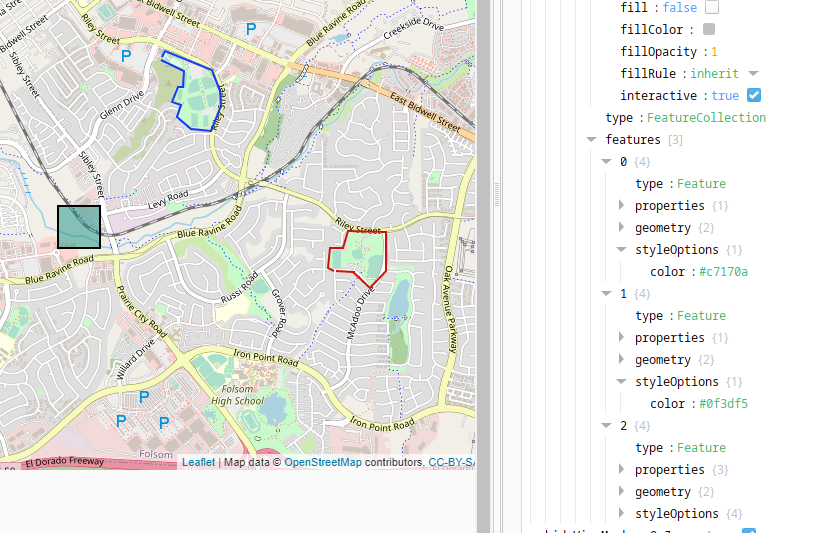
Now that our map is using the updated data, you should see that the "properties" object under each feature contains some styling properties. However, they are being ignored. This is because we need to add a "styleOptions" object in each feature, and relocate the styling configurations so they're under the new object.
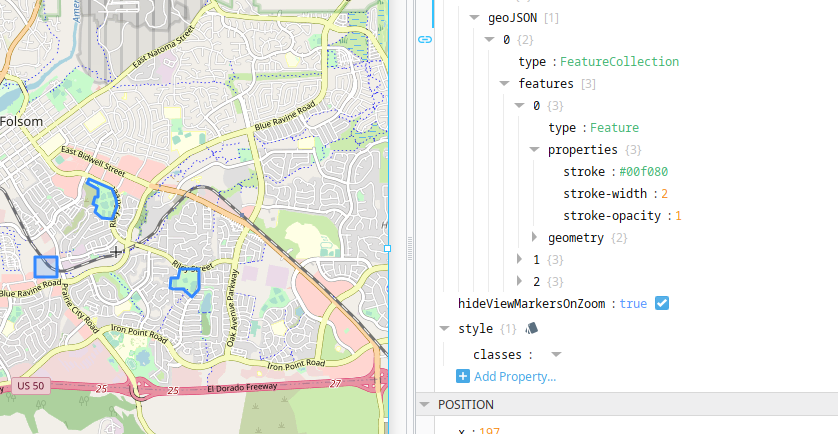
In addition, we should also add a shared styleOptions object as a peer to all of our features. This allows each feature to only override the style settings they need to. In other words, we want something like this:
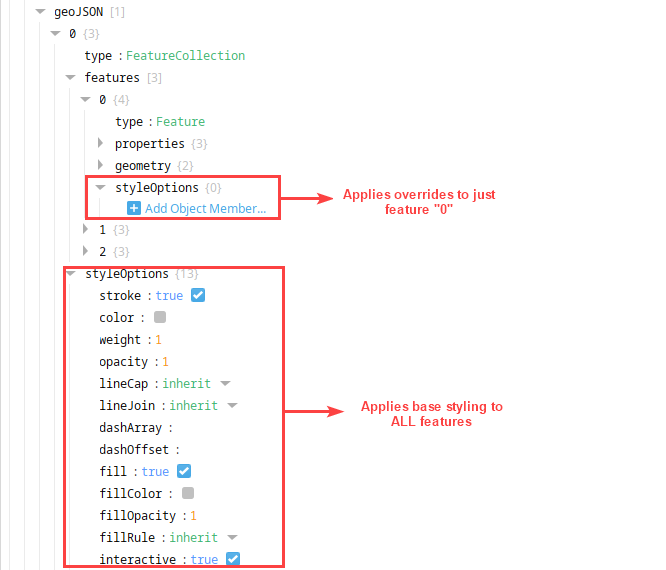
We can do this automatically with a Script Transform.
-
Select the Map component.
-
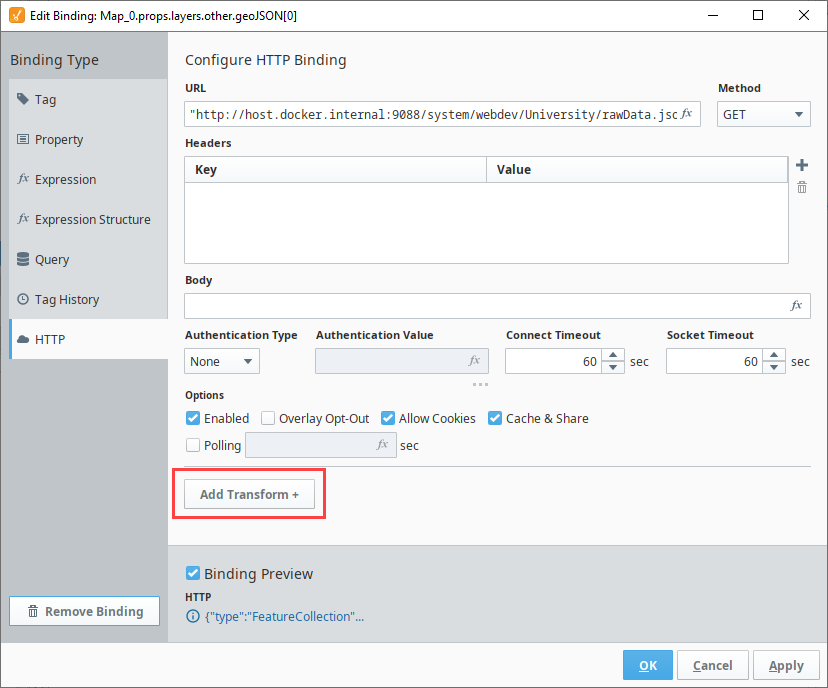
Locate the binding on props.layers.other.geoJSON.0, and click the link icon to open the binding window.
-
Click the Add Transform button.
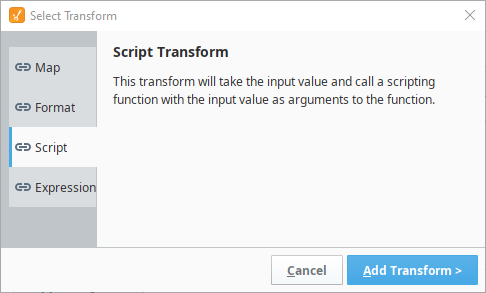
-
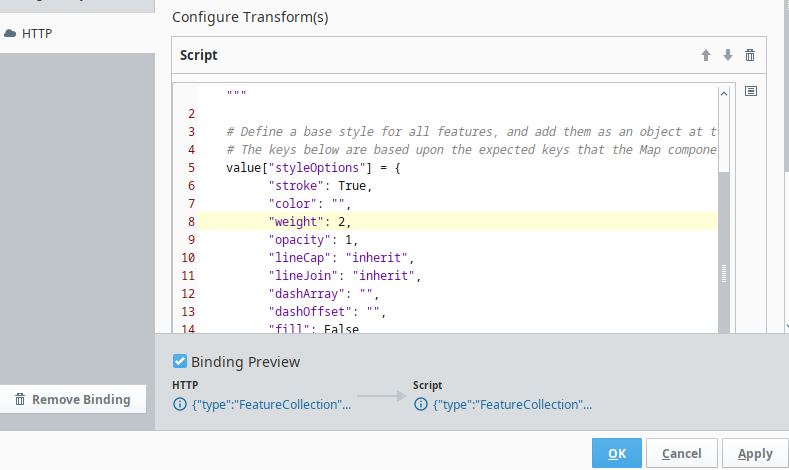
Select "Script" and click Add Transform >.
-
Locate the first line of editable code. Replace that with the code below.
# Define a base style for all features, and add them as an object at the root of our results.
# The keys below are based upon the expected keys that the Map component supports.
value["styleOptions"] = {
    "stroke": True,
    "color": "",
    "weight": 2,
    "opacity": 1,
    "lineCap": "inherit",
    "lineJoin": "inherit",
    "dashArray": "",
    "dashOffset": "",
    "fill": False,
    "fillColor": "",
    "fillOpacity": 1,
    "fillRule": "inherit",
    "interactive": True
    }

#Here we iterate all of the features within our data.
for i in value["features"]:

    # Inside each feature, we can examine each key in "properties", and add custom styling
    i["styleOptions"] = {}
    if i["properties"].has_key("stroke"):
        i["styleOptions"]["color"] = i["properties"]["stroke"]

    # Note that we need to both enable fill and specify the fill color if the feature has "fill"
    # under its raw properties key. This is because our base style above set "fill" to False.
    if i["properties"].has_key("fill"):
        i["styleOptions"]["fillColor"] = i["properties"]["fill"]
        i["styleOptions"]["fill"] = True

    # Here we also need to change "fill-opacity" to "fillOpacity", to match the map's default styleOptions keys.
    if i["properties"].has_key("fill-opacity"):
        i["styleOptions"]["fillOpacity"] = i["properties"]["fill-opacity"]


return valuenoteMake sure the code is properly indented after pasting. No visible characters should appear on the far left of any line.
-
Click OK to close the binding window. Your features should now be using the updated styling data.
Adding Points
The geoJSON standard accounts for "points", which can be rendered on the map as icon based markers or simple circles. The following JSON demonstrates how to define a simple point. Note that geometry.type is set to "Point".
{
  "type": "Feature",
  "properties": {},
  "geometry": {
    "type": "Point",
    "coordinates": [
      "-121.16945743560791",
      "38.6632293081453"
    ]
  }
}
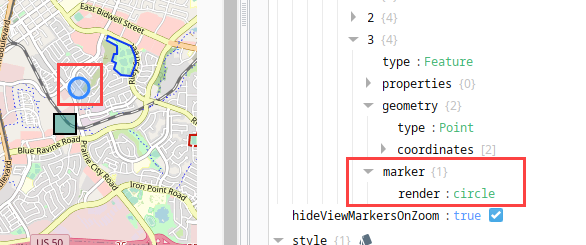
A "marker" object can be added to points which allows for additional configuration options. For example, the following causes the point to be rendered as a circle instead of an icon.
{
 "type": "Feature",
  "properties": {},
  "geometry": {
    "type": "Point",
    "coordinates": [
      "-121.16945743560791",
      "38.6632293081453"
    ]
  },
  "marker": {
    "render": "circle"
  }
}
Customizing Points
Points are rendered using the leaflet library, and can utilize options available in the leaflet documentation. The sections below demonstrate some available functionality. Each sub heading describes an additional object that can be added under a marker object.
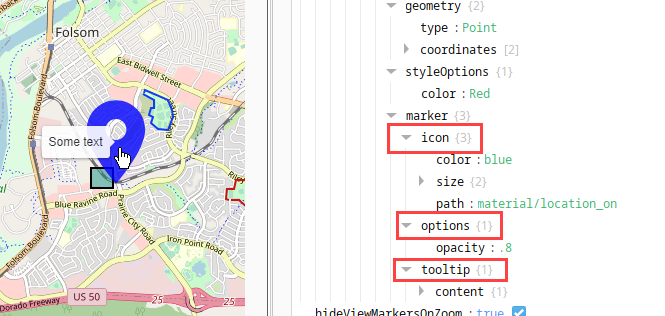
Options Object
Additional settings for the marker can be applied on an options object under the marker object. A list of available options can be found in leaflet's documentation. The example below simply changes the opacity on the marker.
[
  {
    "type": "Feature",
    "properties": {},
    "geometry": {
      "type": "Point",
      "coordinates": [
        "-121.16945743560791",
        "38.6632293081453"
      ]
    },
    "marker": {
      "options": {
        "opacity": 0.5
      }
    }
  }
]
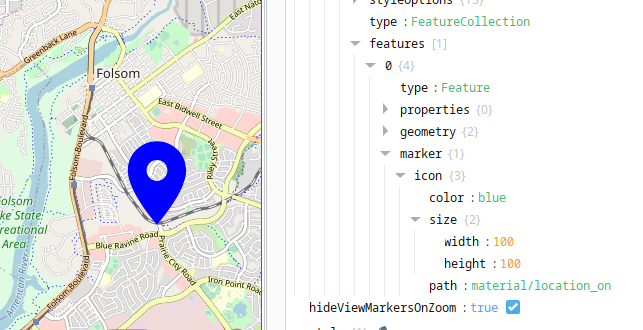
Icon Object
When rendered as an icon, a icon object can be added to configure the icon.
| Setting | Description |
|---|---|
| color | A color, as represented by a string. Determines the color of the icon. |
| size | An array with two values: width and height. Determines the size of the icon. |
| path | A path to an icon. Uses the same icon library and pathing notation as the Icon component. |
{
  "type": "Feature",
  "properties": {},
  "geometry": {
    "type": "Point",
    "coordinates": [
      -121.16945743560791,
      38.6632293081453
    ]
  },
  "marker": {
    "icon": {
      "color": "blue",
      "size": {
        "width": 100,
        "height": 100
      },
      "path": "material/location_on"
    },
    "tooltip": {
      "content": {
        "text": "Some text"
      }
    }
  }
}
Tooltip Object
Tools tips can shown while hovering over a point. The text of the tooltip is driven by marker.tooltip.content.text.
[
  {
    "type": "Feature",
    "properties": {},
    "geometry": {
      "type": "Point",
      "coordinates": [
        "-121.16945743560791",
        "38.6632293081453"
      ]
    },
    "marker": {
      "tooltip": {
        "content": {
          "text": "This is my tooltip"
        }
      }
    }
  }
]
In addition, extra options can be added. See leaflet's documentation for a list of tooltip options. The example below changes the opacity on the tooltip to .5.
{
  "type": "Feature",
  "properties": {},
  "geometry": {
    "type": "Point",
    "coordinates": [
      "-121.16945743560791",
      "38.6632293081453"
    ]
  },
  "marker": {
    "tooltip": {
      "content": {
        "text": "This is my tooltip"
      },
      "options": {
        "opacity": ".5"
      }
    }
  }
}
Popup Object
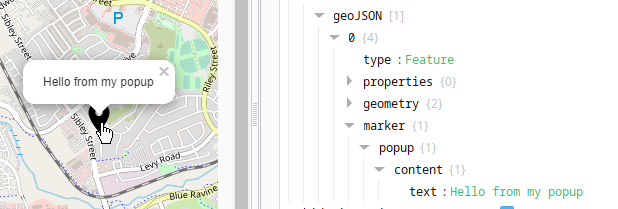
Simplistic popups can be added to points by adding a marker.popup.content.text property. Clicking such a marker will cause a popup to appear.
{
  "type": "Feature",
  "properties": {},
  "geometry": {
    "type": "Point",
    "coordinates": [
      "-121.16945743560791",
      "38.6632293081453"
    ]
  },
  "marker": {
    "popup": {
      "content": {
        "text": "Hello from my popup"
      }
    }
  }
}
Like tooltips popups have additional options that can be specified in an options object. See leaflet's popup documentation for a list of possible options.
{
  "type": "Feature",
  "properties": {},
  "geometry": {
    "type": "Point",
    "coordinates": [
      "-121.16945743560791",
      "38.6632293081453"
    ]
  },
  "marker": {
    "popup": {
      "content": {
        "text": "Hello from my popup"
      },
      "options": {
        "minWidth": 400
      }
    }
  }
}
All Together
Each of these marker objects can be applied simultaneously, each adding additional functionality.