Report Tables
Tables are a major part of Ignition Reporting, taking provided data and displaying it in a structured way. The Reporting engine will automatically create new pages to fit all data within the Table's boundaries while applying formatting preferences such as font, size, layout and alignment.
Let's start by looking at the various parts of the Table component and move into more features.
The Table Component
You can create a new table one of two ways. If you simply drag a Table ![]() component from the Report Design Palette, you'll see a new table populate with no bound Data Key. A data source will need to be placed in the Data Key field to use the Table functionality.
component from the Report Design Palette, you'll see a new table populate with no bound Data Key. A data source will need to be placed in the Data Key field to use the Table functionality.

If you already know what your data source is going to be, you can select and drag it onto a page in your report and it will populate a new Table with that Data Source as the Data Key.
Anatomy of a Table
To best understand how to use a Table to illustrate data in a report, you need to have a basic understanding of how the report table works. A table has multiple sections, each with its own properties. By default, a Table consists of three sections:
-
Table Body - Gray area at the bottom of the table template that will end up getting filled with the data rows. You can stretch and shrink the table boundaries to position and size a table.

-
Table Rows - There are three types of table rows: Header, Details, and Summary. A table row can also be structured or unstructured. More information on these row types can be found on the Table Rows page.

-
Text Shapes/Cells - Available only in a structured table row. In Reporting, Text Shapes are commonly referred to as cells. You can select multiple cells with alt (select specific cells together with individual clicks) or shift (select all the cells between the first and last cell clicked).

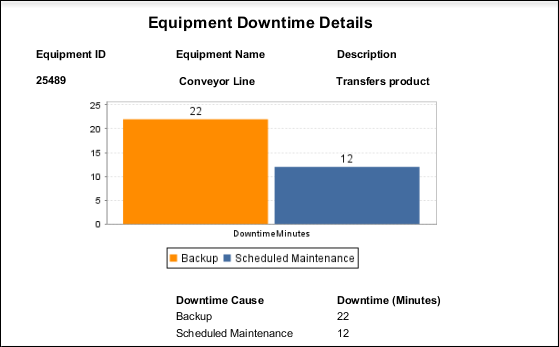
The following example shows the basic anatomy of a Table with data populated in the Header, Details, and Summary rows. Once you're finished designing your report, go to the Preview panel and check your results. You can continue to navigate between the Design and the Preview panels making changes until you like the look of your report.
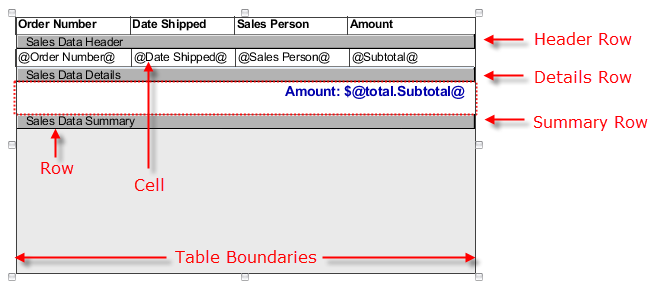
Each section (i.e., Table, Rows, and Cells), when selected, has its own unique properties (shown below), along with some common basic properties that appear in the Properties tab of the Property Inspector. Refer to the Table page in the Appendix for a complete list of all Table properties.
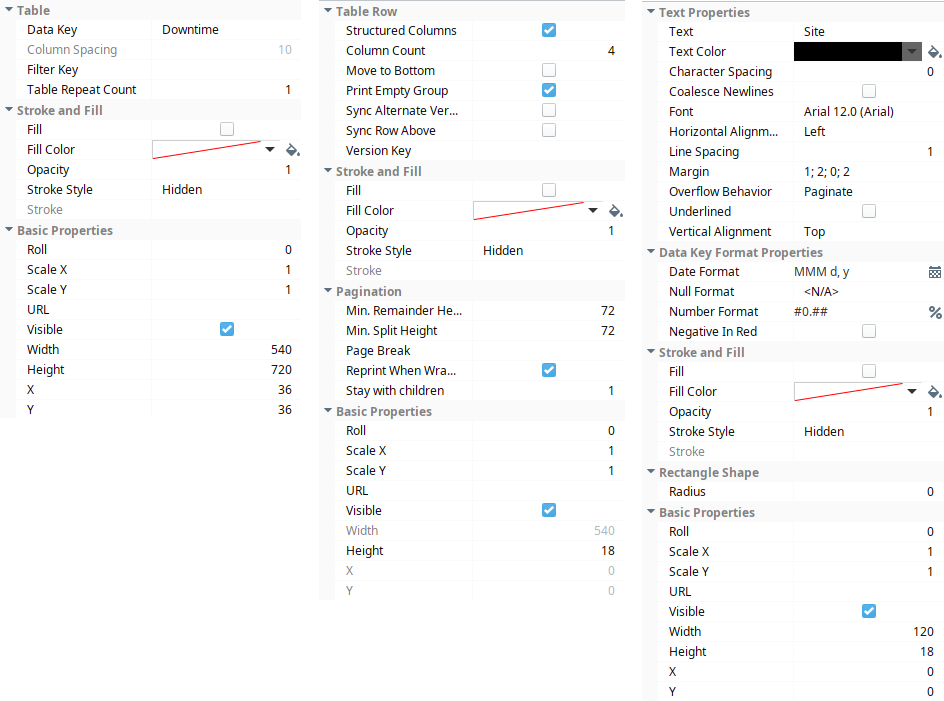
Table Configuration
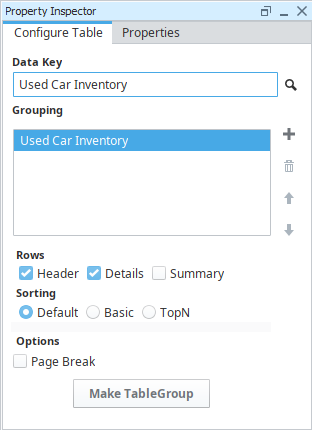
When you first drag a table into the Design panel of your report, the Configure Table tab will appear in the Property Inspector. You will see that it has a default Data Key of "Objects", which matches the Details row in the table. The first step when configuring your table is to drag your Datasource from the Key Browser to the Data Key field in the Configure Table tab. Changing the Data Key will also change the label on the Details row making it easier to determine what you are looking at when editing multiple tables or Groupings. Depending on how you want to present your data, you may also want to add Header and Summary Rows.
The Data Key field represents the data source that the table will pull records from. The Table can only have a single data source assigned to it. If the table needs to display values from multiple data sources, then a Nested Query should be used to collect all the values, and then assigned to the table's Data Key setting.
Once you add a Data Key to your table, you can start designing. There are many Table interface tools that you can use to layout and organize the data in your table, for instance:
- If you have a lot of tabular data, you probably want to use a Standard row. You can start by dragging your Data Source Data Keys from the Key Browser to columns in your Details row. When column data is assigned, you can then give each Header column a label.
- Create a Summary row for any data that you want to manipulate before it's displayed, such a calculating totals, averages, or min/max values. Make sure to enable the Show Calculations property, and choose the calculation key needed.
- Consider cosmetic changes you can make to the font size, font color, or changing the Header row from structured to unstructured so you can add an image, chart, text shapes, etc.
Report Table Features
Tables have a lot of built-in features that give the ability to create simple tables and increasingly more complicated tables. The features not only allow you to organize your tabular data, they also provide sophisticated data manipulation and layout tools. As briefly mentioned earlier on the page, Header, Details, and Summary are the three types of table rows that make up the body of a table. You can break tables down by Data Keys that share a common value using Dataset Grouping. The different types of rows can be independently enabled for each level of grouping, with each group having its own Header, Details, and Summary rows. Additionally, the keys from 'Show Calculations' and other keychain functions are supported for any level of grouping.
By default, when you initially create a table all the row types are structured. A structured row has a variable number of columns and allows you to organize your text based table data, while an unstructured row is highly customizable allowing you to place images, text shapes, and charts within the table row. Unstructured rows are perfect for placing charts anywhere within the row of the table. An unstructured Details row typically works best when used in conjunction with Grouping Data Inside of Tables or Nested Queries so that each row has a chart with data from that group or query.
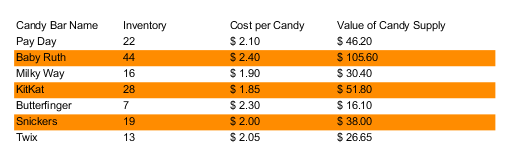
Another feature is Table Row Versioning which gives you the option of displaying rows with a different format to make them stand out, such as creating an alternate background row color, making the first row different, or even creating your own custom row version. You have have a choice of using any of the built-in row versioning options or creating a custom version.
Report Tables also support Table Grouping which is an easy way to add multiple data sources to an existing table in a report using Peer Tables and Child Tables. Peer Table groups allow the second table to begin exactly where the first table ends. Child Table groups allow you to nest one table inside another. What's really nice about Table Groups and Nested Data Sources is that you can create Summary Tables for categories of items or drill-down charts all in one report.
Once you get familiar with all the report table features, you can easily design professional tables for your reports.
Other Table Components
There are a couple other table components in the Report Module: Simple Table and CrossTab Table. Selecting the right table depends on the type of data you have and how you want to display it.
The Simple Table is similar to a basic table that dynamically crates new rows and columns for rows returned by the Data Keys on the component. With a Simple Table, you can very quickly add a table inside a report.
The CrossTab Table is commonly used to summarize the relationship between two groupings of data by showing summaries of cross sections of the datasource. The CrossTab Table has lots of repetitious data, a datasource that provides at least two columns of data which are repetitious compared to the number of rows, and one or more columns that represent a value that requires a calculation. This table will stretch both its height and width to accommodate the underlying dataset.