CrossTab and Simple Tables
In the other sections of the Report Table, we talked about creating tables using the Table component, commonly referred to as Standard Tables. Standard Tables focus on a dynamic number of rows with static columns, however, there are other table types that behave a little differently. These other table types are the Simple Table and CrossTab Table.
The CrossTab Table, although similar to standard tables and charts, is commonly used to summarize the relationship between two categories of data by showing summaries of datasource cross sections. The Simple Table allows you to easily create a grid-like table structure with the rows and columns being dynamic. Both table types are described below.
The examples on this page assume you already have datasources created. If not, you can copy the data from the code blocks in each example to create your own datasources.
CrossTab Table
The Cross-Tabulation or CrossTab component is a tabular data element like the Table and Charts. Also known as Contingency Tables, they are commonly used to summarize the relationship between two categories of data by showing summaries of cross sections of the data source. To be useful, crosstab data should have the following:
- Lots of repetitious data. Sums, Averages, and other Aggregating functions are well represented by CrossTab Tables.
- A data source that provides at least two columns of data which are repetitious compared to the number of rows.
- One or more columns that represent a value that requires calculation. Examples are: summing money, displaying average response times, counting occurrences, etc. These calculations may be provided as columns or calculations of the data source, or as Keychain Expressions.
The CrossTab component is much simpler than the Table component. By default, it just shows a single cell. This is usually configured with an aggregate key, like "@total.getAmount@". After that, grouping keys are dragged to the horizontal and vertical axis.
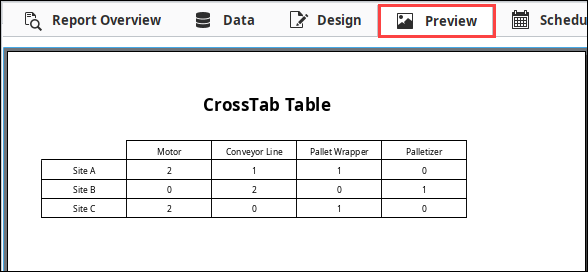
The objective of this CrossTab example is to show the number downtime time events by site and equipment. Let's give it a try!
-
In the Data panel, create a CSV data source named Downtime_by_Site. You can copy the data from the Code Block below to create your own CSV Data Source.
Downtime_by_SiteEquipment,Time,Site
Motor,15,Site A
Motor,23,Site A
Conveyor Line,148,Site B
Pallet Wrapper,58,Site A
Motor,96,Site C
Conveyor Line, 23, Site B
Palletizer,40,Site B
Conveyor Line,56,Site A
Pallet Wrapper,45,Site C
Motor,43,Site C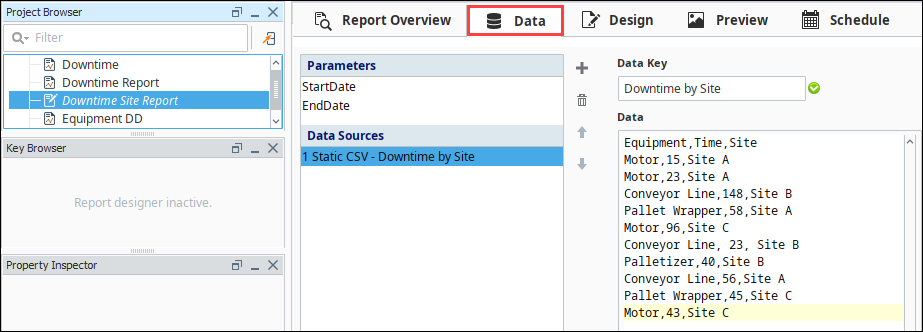
-
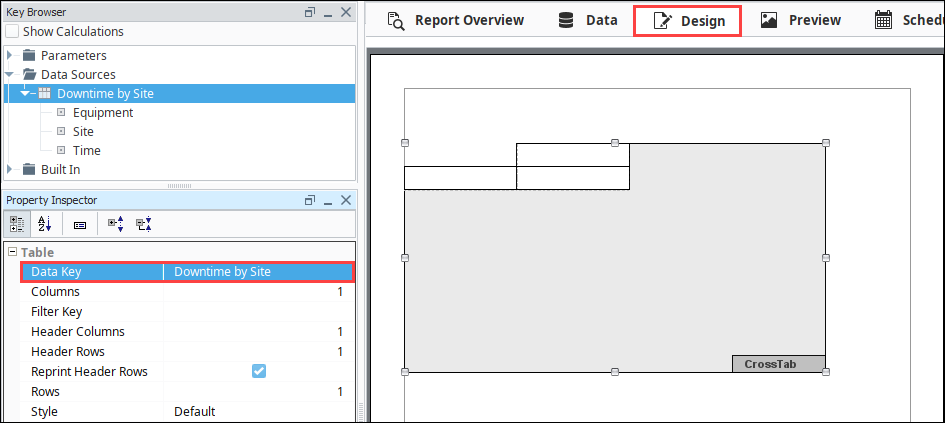
In the Design panel, drag a CrossTab component
 to your report.
 -
With the CrossTab component still selected, drag-and-drop your Data Key (i.e., Downtime by Site) from the Key Browser to the Data Key property in the Property Inspector.
-
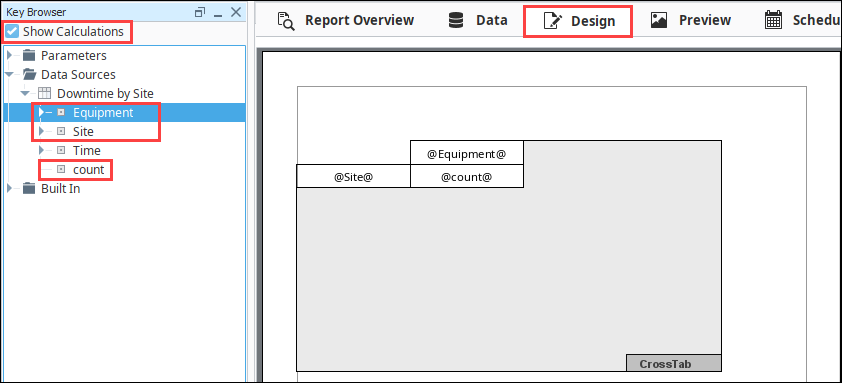
In the Key Browser, set the Show Calculations property to true.
-
Next, add some data keys to the cells in the CrossTab Table component. From the Key Browser, drag '@Equipment@' to the top cell, '@Site@' to the leftmost cell, and '@count@' to the remaining cell. This will show the amount each piece of equipment experienced downtime by site.
-
Switch to the Preview panel and your CrossTab Table will display the results.
Simple Table
The Simple Table is a grid-like table structure that dynamically creates new rows and columns for rows returned by the Data Keys on the component. With the Simple Table you can very quickly add a table inside a report.
The objective of this Simple Table example is to show each piece of equipment including the total amount of downtime, occurrences, and the average duration of each occurrence, broken down by each piece of equipment.
-
In the Data panel, create a CSV data source named equipment_downtime. You can copy the data from the Code Block below to create your own CSV Data Source.
equipment_downtimeequipment,downtime
conveyor line,78
filler, 68
labeler,84
palletizer,27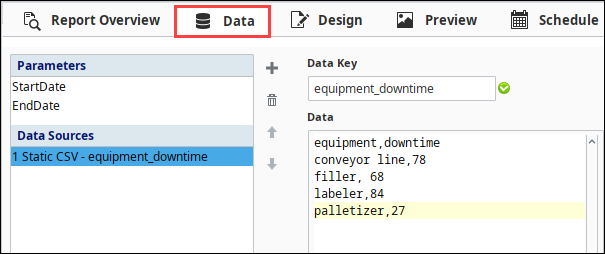
-
In the Design panel, drag a Simple Table component
 to your report.
 -
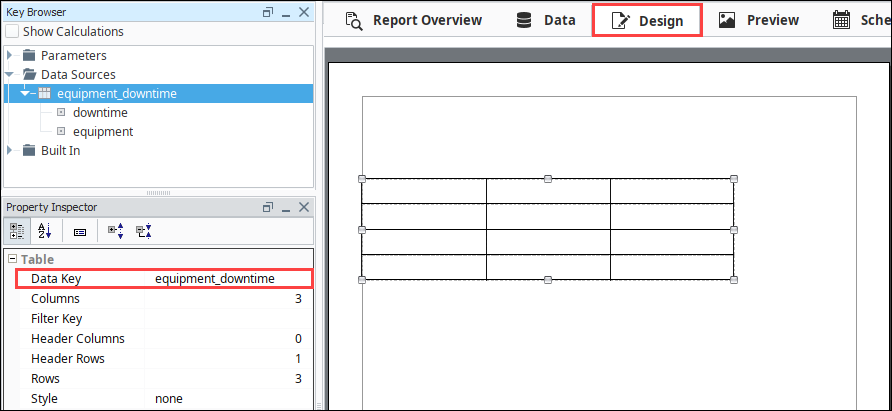
With the Simple Table component selected, drag and drop your Data key (i.e, equipment_downtime) from the Key Browser to the Data Key property of the Property Inspector.
-
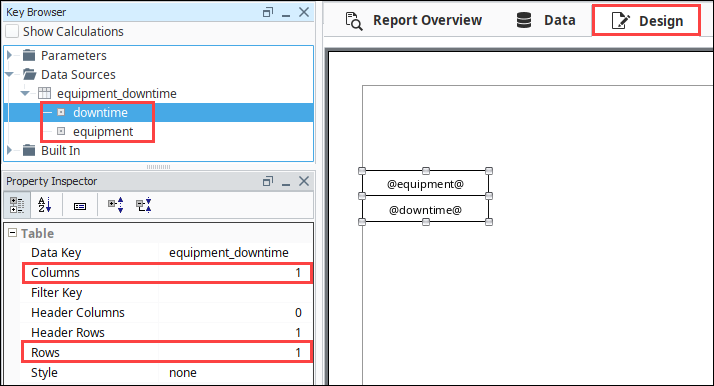
From the Key Browser, drag the '@equipment@' key to the top row of the Simple Table, and the '@downtime@' key to the second row.
Header RowIt's important to note that the top row of the Simple Table is a Header Row. In the Property Inspector, there is one Header Row, but you can always add more rows by changing the value, or even setting it to '0' to remove the Header Row.
-
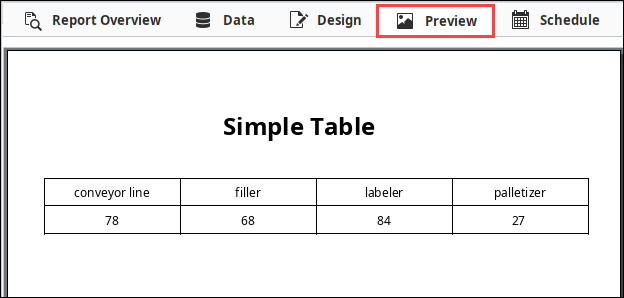
In the Property Inspector, change the number of Rows and Columns to 1. If you need to add or remove columns or rows, you can always change the Column and Row property values. Because the data keys determine how many columns and rows get created in your table, the Simple Table will add a new column for each value in the 'equipment' key, which will be visible on the Preview panel.
-
Next, switch to the Preview panel to check out your report. You can always go back to the Design panel to edit your table and update your report format.