Report Designer Interface
Built to be intuitive and familiar, the Reporting workspace has a logical workflow which makes it easy for anyone to create meaningful reports. Before we talk about the workflow, let's first mention where you create and find your Reports. Any report that is created in your project will be located in the Project Browser under Reports.
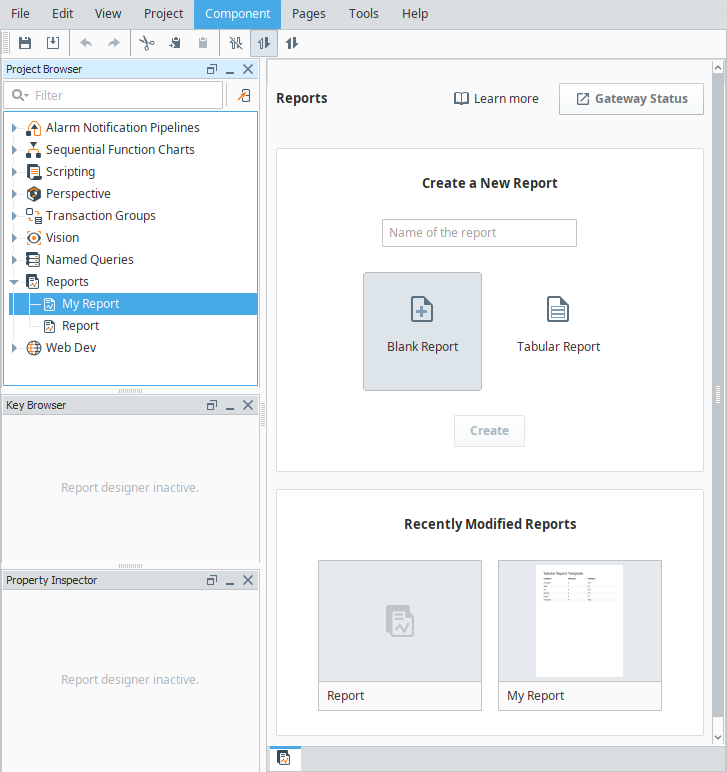
The Reports Welcome tab presents you with two types of reports to help get you started: a Blank report and a Tabular report. The Blank report allows you design your report from scratch. The Tabular report is a template with some sample data and a report design. This is helpful if you want to present the data in your report in tabular format.
It will even show you the most recently modified reports along with the thumbnail of the report. The Reports Welcome tab provides a quick way to create a new report and update an existing report. To create a report, select a report type, enter a report name, and click Create. Once you've opened an existing report or created a new one, you'll be taken to the Report workspace. The Report workspace has five tabs which make up the workflow of a report: Report Overview, Data, Design, Preview, and Schedule tabs.
Report Overview Tab
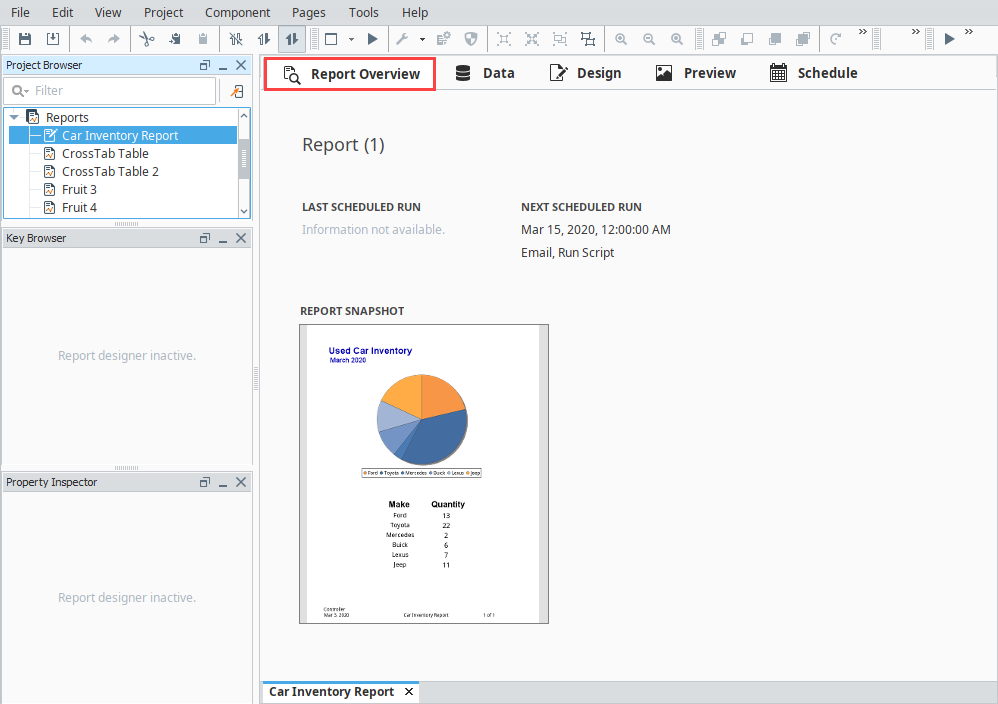
Once you create a report, the first step in the report workflow process is the Report Overview. The Report Overview tab provides valuable information at a glance about your report. At the top, you'll see the name that you entered when creating your report. You can click on it to rename it if desired. Under the name, is a thumbnail of the most recent report, its last execution time, and the next scheduled execution.
Data Tab
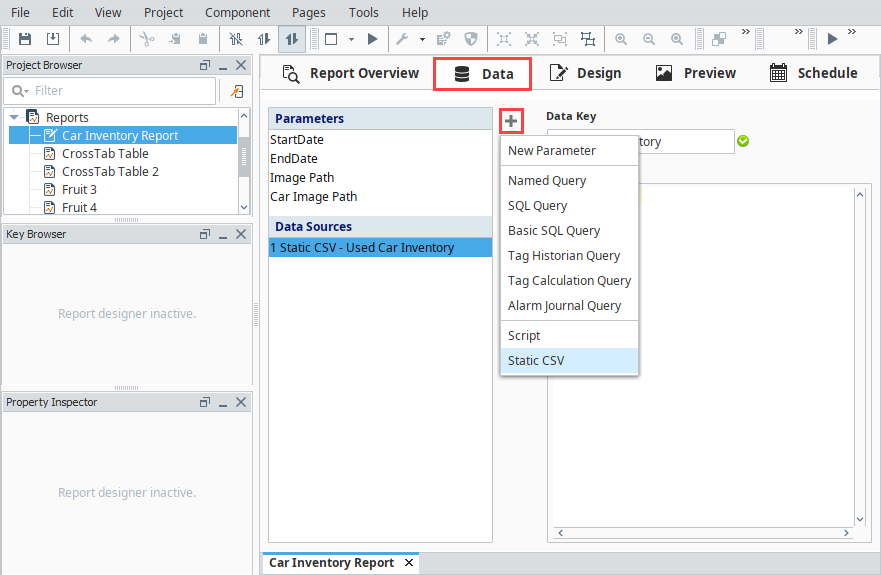
The Data tab is the first stop for configuring a new report. You'll notice the list on the left that has labels for Parameters and Data Sources, as well as some buttons. On this page you can generate data that you want to make available on your report. Click the Add ![]() icon to see a list of built-in Data Sources and Parameters. Selecting any one of them will open the configuration screen for that Data Source type and enable you to start configuring the data for your report.
icon to see a list of built-in Data Sources and Parameters. Selecting any one of them will open the configuration screen for that Data Source type and enable you to start configuring the data for your report.
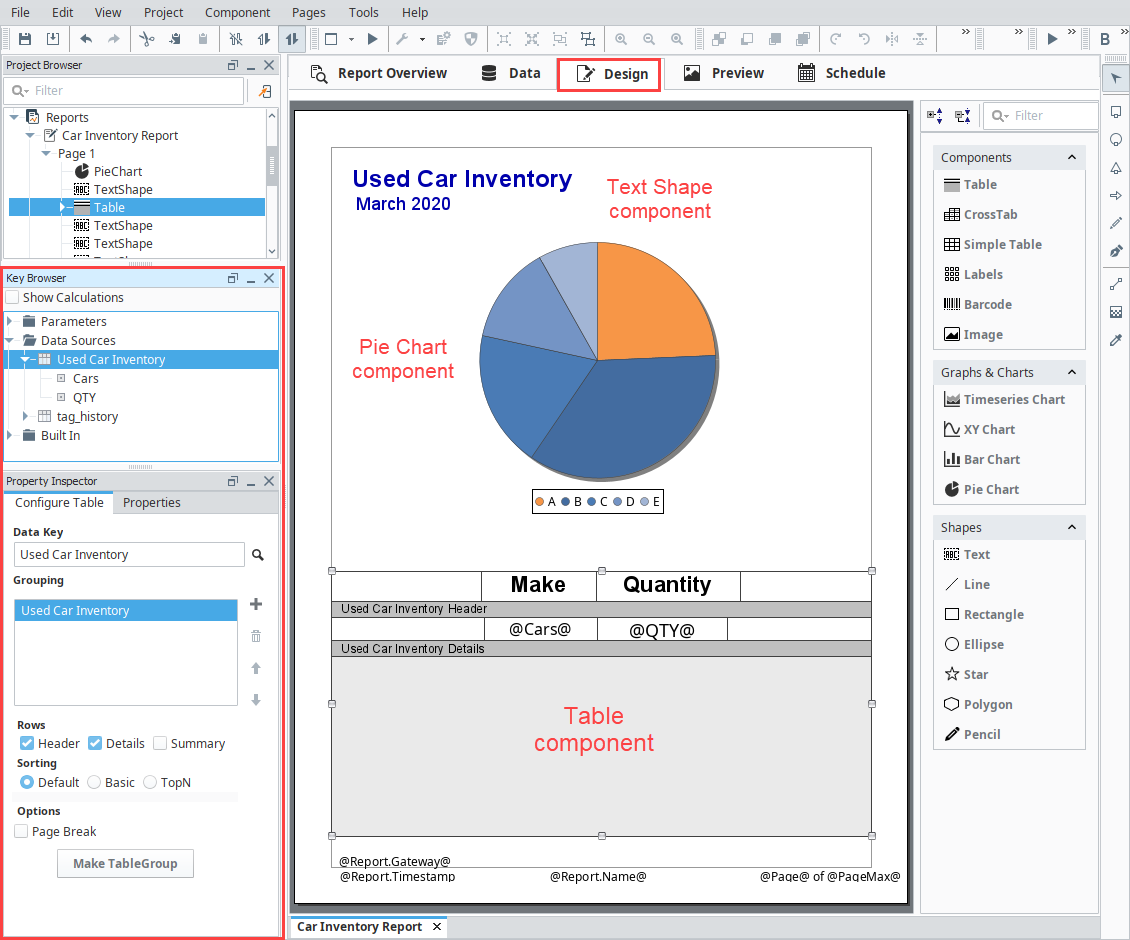
Design Tab
If you've ever designed a Vision Window, the Design tab should make you feel right at home. Starting from the top-left, the structure of a Report is represented in the Project Browser tree, allowing easy visualization of the tree of elements on your report. You can grab a component off the Reporting Palette on the far right and add it to the page. In place of the Tag Browser, there is a Key Browser that gives you an easy way to add the Data Sources and Parameters that you configured in the Data panel to the Report. For complex components, there are configuration panels in the Property Inspector to supplement the Property Inspector table that all the design objects have. Depending on your panel configuration, the Key Browser and Property Inspector panels may always present, but they are only usable when actively designing your report.
Key Browser
The Key Browser contains two very important elements: Data Keys and Built-in Keys. Data Keys are used to pull values from your data sources that you configure in the Data tab and display them in your report. They act as placeholders for your data and resolve to values when your report is generated. Built-In Keys are utility type functions that are commonly used when generating a report, such as adding a report name, date, and page numbers.
Property Inspector
The Property Inspector is similar to the Property Editor in the Designer. It displays the properties of the selected component, but also includes configuration tabs for a number of the more complex report design objects such as the Pie Chart, Barcode, Tables, etc. The configuration tabs are specific to the selected Report component, and will only be used for the Report Design Components.
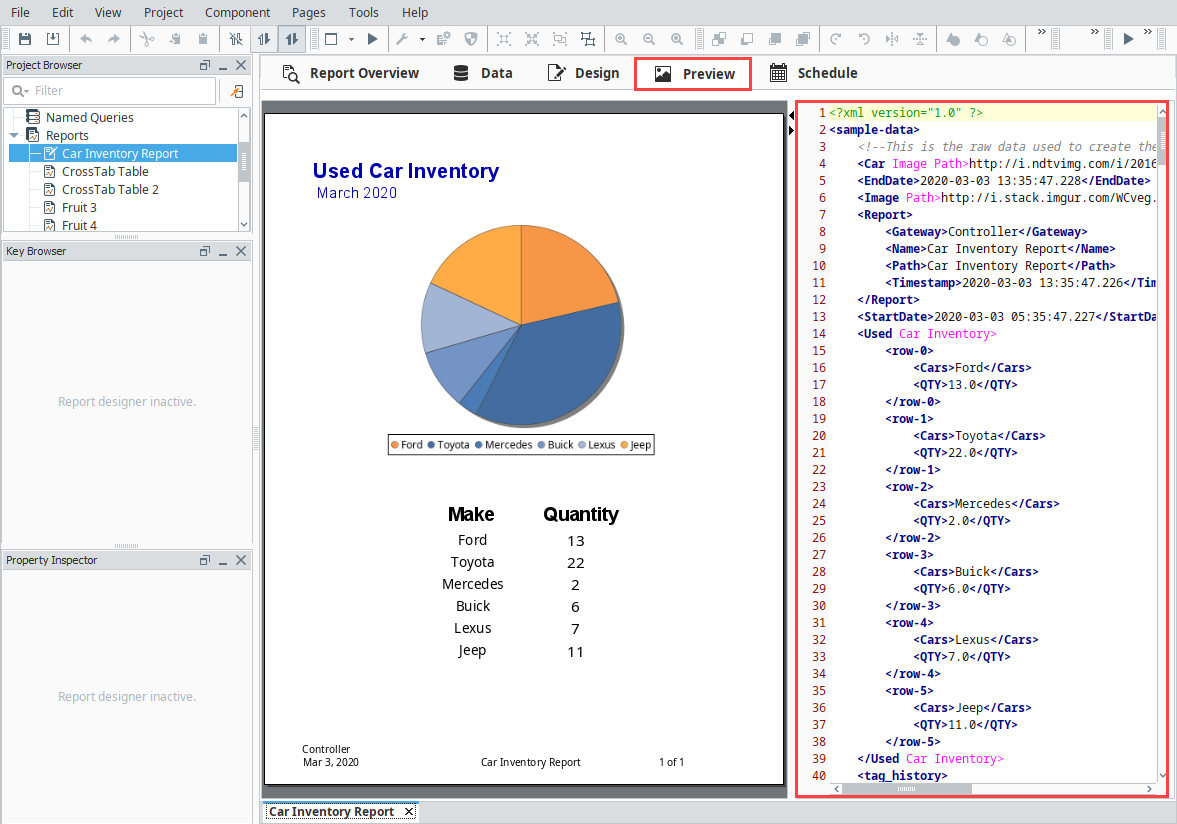
Preview Tab
The Preview tab provides quick visual feedback on your report while you're building it. Not only does it provide you an instant example of what your report looks like, but it also gives you the ability to view the actual data next to your report preview. Having a snapshot of your data can be incredibly helpful when trying to figure out why your report doesn't appear as you expect it to. Whether you have an error in your query, or a bad Data Key in a component, you'll be able to figure out the structure of the data your report is getting and quickly find ways to solve any problems.
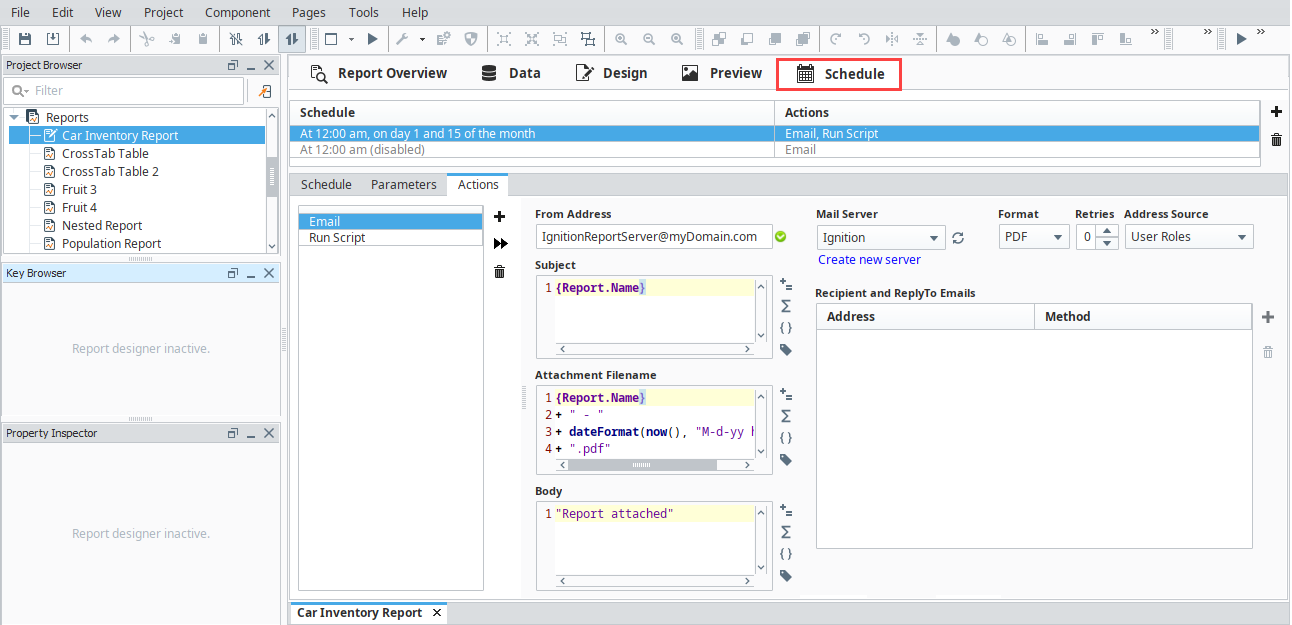
Schedule Tab
Scheduling a report to run is built-in and easy to use. Reports must have a schedule to run. The Schedule tab is an incredibly powerful way to automate the execution and delivery of your reports. It's divided into two major areas, to list existing schedules and to configure schedules. On top, you'll see a simple table of schedules that have been established. To add a schedule, click the Add ![]() icon. With a schedule added, you can now choose when and how that scheduled Action will occur. Schedules use the common Cron format. If you aren't familiar with it. The preset options and combo-box configurability allow you to easily create just about any schedule you can imagine.
icon. With a schedule added, you can now choose when and how that scheduled Action will occur. Schedules use the common Cron format. If you aren't familiar with it. The preset options and combo-box configurability allow you to easily create just about any schedule you can imagine.
Once you've selected your schedule, you can add parameters that may affect your Actions. Actions are incredibly powerful and allow you to choose how you want to distribute or act on your finished reports. Whether saving a file locally, posting to an FTP server, or emailing, you can get your report where it needs to be automatically. If our normal distribution Actions somehow fall short, you can choose to act on the finished report by triggering a script. We've also given you a convenient way of immediately executing the Action.