Table Groups
Table groups are a single component that contains many tables, each with its own unique data. There are two types of Table Groups you can create within a Table component: Peer Tables and Child Tables. Peer Table Groups allow the second table to begin exactly where the first table ends. If multiple tables are used, they can be configured as multiple page templates, providing a page break between tables. Child Table Groups allow you to nest one table inside another, and work especially well with any Nested Queries. What's really nice about Table Groups and Nested Data Sources is that you can create Summary Tables for categories of items or drill-down charts all in one report.
Table Groups and Grouping Data in Tables are two completely different things despite having similar names. Table Grouping (this page) involves using multiple datasets in the same Table component while Grouping Data Inside of Tables sorts the rows inside a single dataset.
Making a Table Group
To make a Table Group, you simply need to click the Make TableGroup ![]() button in the Configure Table tab of your table. You will be able to tell that it worked when you notice a Table Group
button in the Configure Table tab of your table. You will be able to tell that it worked when you notice a Table Group ![]() icon displayed in the lower left corner of the table component, and your Configure Table tab has now changed into a Configure TableGroup tab.
icon displayed in the lower left corner of the table component, and your Configure Table tab has now changed into a Configure TableGroup tab.
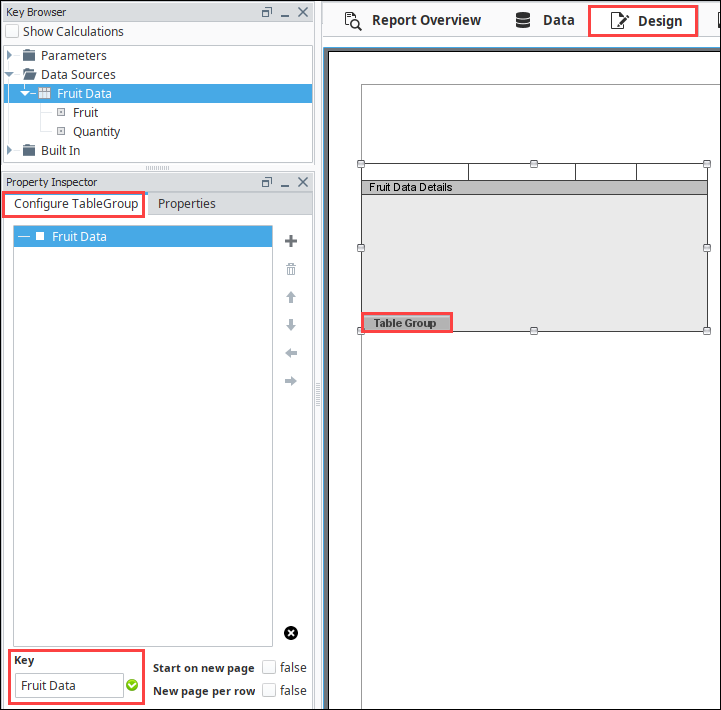
We can see our original table listed in the Configure TableGroup tab, and we have the option to add additional tables by clicking the plus ![]() icon. Adding a child table will add a table that is a child to the table that is currently selected in the Table Group list. Adding a peer table will add a table that is a peer to the currently selected table. We can add as many of each of these as we need.
icon. Adding a child table will add a table that is a child to the table that is currently selected in the Table Group list. Adding a peer table will add a table that is a peer to the currently selected table. We can add as many of each of these as we need.
For example, in the image below we added two child tables to the original Fruit Data table. We then have two peer tables to Fruit Data, one of them is a standalone table, while one has a child table with that child table also having a child table. More information on child and peer tables is included below.
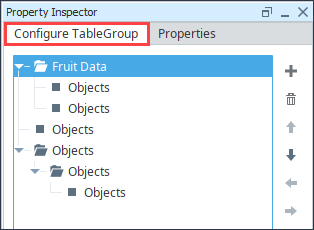
As you can see from the image above, the Table Group hierarchy can get quite confusing very quickly. It is important to understand how each part of the Table Group works, and to always be aware of which table you are actually looking at inside the Table Group. To view a different table within the Table Group, simply select it from the hierarchy. The table displayed in the design area will switch depending on which table you selected.
Navigating Within Table Groups
Fruit Data Selected
Objects Selected
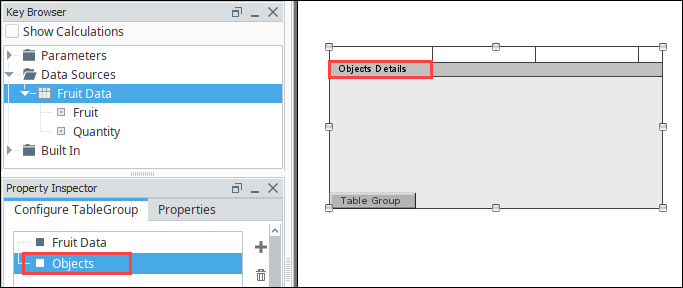
This allows you to get a quick preview of how each of the tables within the Table Group are set up. To go in and configure an individual table within the Table Group, select it from the hierarchy and then click on the table object in the design area. The Configure TableGroup tab in the Property Inspector should change to the Configure Table tab, and will display properties relevant to the table you had selected. This allows you to add a Data Key, set grouping, configure relevant row styles, and format the table in any way that you want. After configuring the table, we can navigate back to the Table Group configuration by clicking on the Table Group ![]() icon in the bottom left corner of the table.
icon in the bottom left corner of the table.
At the bottom of the Configure TableGroup tab, there is an option called Start on new page. With this option enabled, we can force the next table in the list to start on the next page instead of immediately after the previous table. This will only apply to the table that is currently selected.
In the Configure TableGroup tab, we can modify the hierarchy of the Table Group using the Arrow ![]() icons to the right of the table list. This allows us to change the order that the tables appear in, change a peer table into a child table, or change a child table into a peer table. If at some point, you realize you have added too many tables, you can also use the Delete
icons to the right of the table list. This allows us to change the order that the tables appear in, change a peer table into a child table, or change a child table into a peer table. If at some point, you realize you have added too many tables, you can also use the Delete ![]() icon to remove it. Be careful, as removing a table that has children will also remove the child tables.
icon to remove it. Be careful, as removing a table that has children will also remove the child tables.
Finally, if you ever want to cancel the Table Group click the Delete Table Group ![]() icon to do so.
icon to do so.
Child versus Peer
When adding tables to a Table Group, they can be added as either a "Child" or "Peer" table. These terms are always relative to adjacent tables in the group's hierarchy. Thus a table that is a child to one table may have some peers, as well as its own child tables. You can always tell the relationship between two tables by the indentation of each table.

Both Table 1 and Table 2 are peers. This is denoted by the matching indentation. In regard to the image above, the following statements are true:
- SubTable 1 and SubTable 2 are both children to Table 1, because they are indented over from their parent.
- SubTable 1 and SubTable 2 are also peers to each other, because they have a matching indentation.
- SubSub 1 is a child to SubTable 2, and does not have any peer or children tables.
When the report is generated, the first row of Table 1 will appear first. Each row of Table 1 will generate an instance of SubTable 1 and SubTable 2. Furthermore, each row of SubTable 2 will generate an instance of SubSub 1. After all of Table 1 has been represented on the report, Table 2 will appear on the report.
The behavior of Peer and Child tables are further described below.
Peer Tables
Peer Tables are inserted one after another in the parent table. One table could potentially show details for each piece of equipment, with the peer table showing something completely unrelated starting at the end of the table before it. This helps keep the flow between two different datasources. Typically, each datasource would get its own table component. The issue with that is where to place them with how the tables automatically grow with more data. You could potentially have large amounts of blank space between the two tables because the first table only has a few records. This allows all the data to flow from one datasource to the next, even with unrelated datasources. You can see in the example below, the first image shows what a single individual table looks like, while the second image is a Table Group of two completely unrelated datasources stacked together. Each table inside the Table Group is also unique, with their own formatting, style, and even row versions.
| Individual Datasource in Singular Table | Table Group with Two Different Datasources |
|---|---|
 | 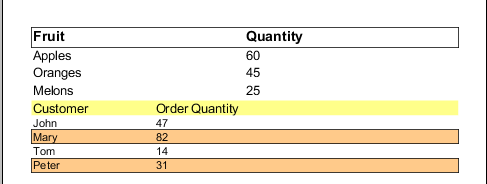 |
Child Tables
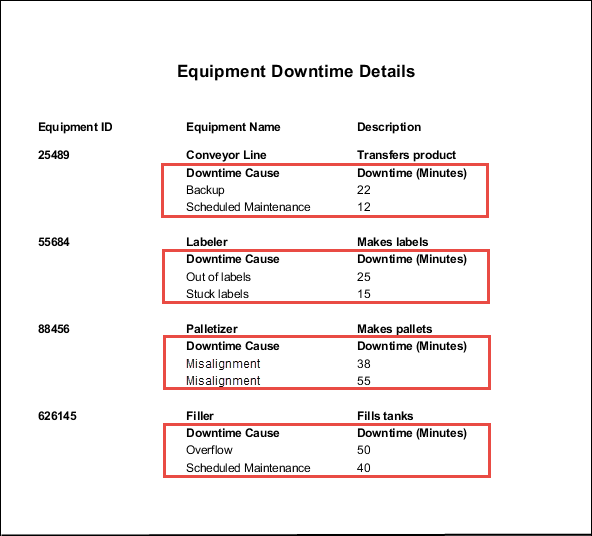
Child table groupings allow you to nest one table inside of another table. One table could potentially show details for each piece of equipment, but with a child table under each row, you can show all of the relevant downtime occurrences for that piece of equipment. These types of tables work well with Nested Queries.
Using Child Tables - An Example
Creating child tables requires having a complex dataset. Go to the Nested Queries Equipment Downtime example if you want to use the same datasets that are used below.
-
Once you have your Data set up, click on the Design tab and add a Table component to your report.
-
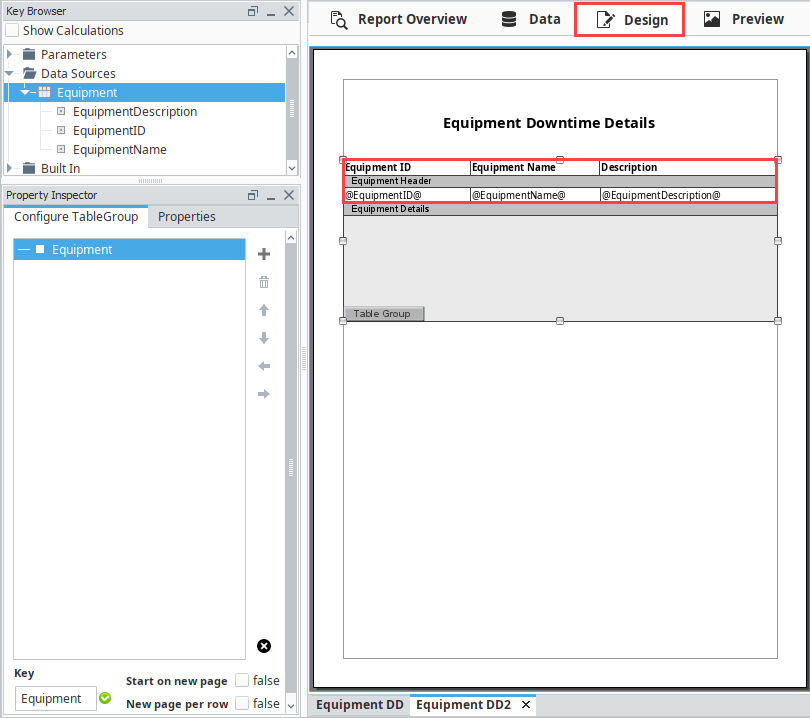
With the table created, add a Header row to the table. Drag all of your Equipment details into the table, and add header titles for each column. Equipment table column headers for this example:
- Equipment ID
- Equipment Name
- Description
-
Now that we have a base table, click the Make TableGroup button at the bottom of the Property Inspector.
-
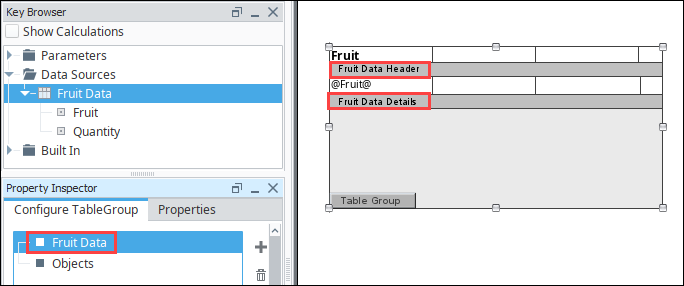
Once you make your TableGroup, you're ready to create a Child Table. In the ConfigureTable Group tab, make sure the Equipment table is selected and click the plus icon
 and select 'Add child table.' The table you create becomes a child of the Equipment table. By default, the child table will be called Objects.
 -
A Child Table has its own datasource and uses a nested query to pull data from the database. Double click on the child table to select it and see the details for that table.
noteYou can switch back to the Configure TableGroup tab by clicking on the Table Group button
 in the lower left of the Table component.
 -
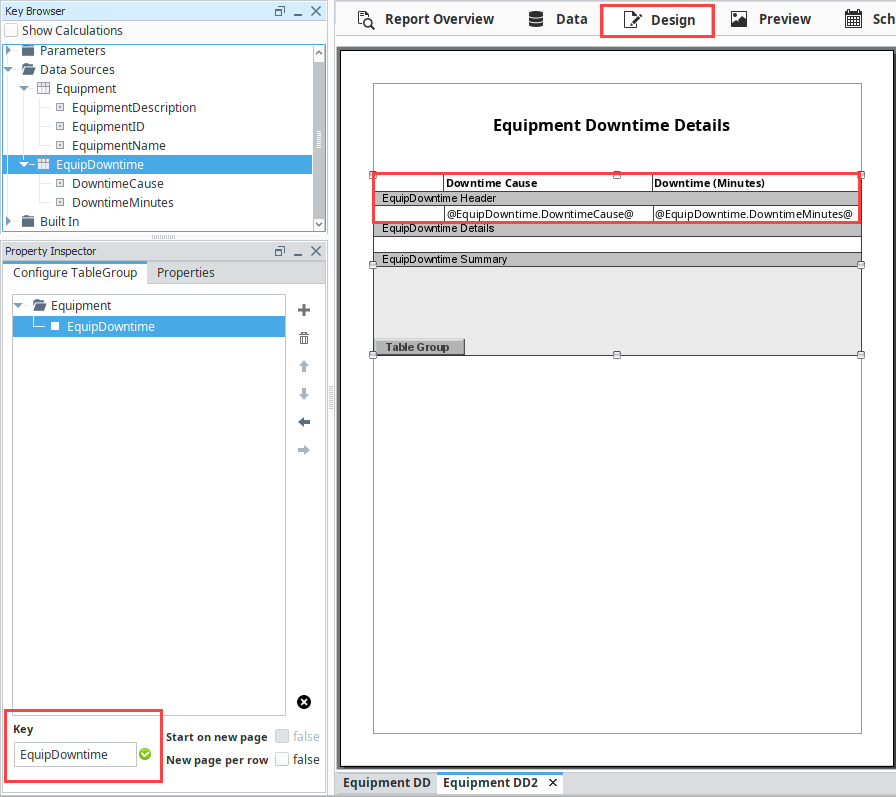
Drag the child datasource (i.e., EquipDowntime) from the Key Browser to the Key field in the Configure TableGroup tab.
-
Next, add a header row with column name text:
- Downtime Cause
- Downtime (Minutes)
-
Drag your columns from the Key Browser to the appropriate columns in your table.
-
Go to the Preview panel to view the report. You'll notice the Child Table is now embedded in the parent table.