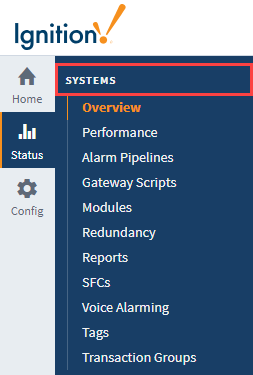
Systems
The Systems section of the Status tab displays information regarding the internal Gateway systems. This includes systems such as the currently running Transaction Groups as well as active Alarm Pipelines. These sections are not necessarily concerned with any connections to external systems.
Overview Section
The Overview page is the first page that you see when navigating to the Status tab. It provides a visual synopsis of everything in the Gateway, as well as some basic information about the server Ignition is installed on. There are four sections on the page: Architecture, Environment, Systems, and Connections.
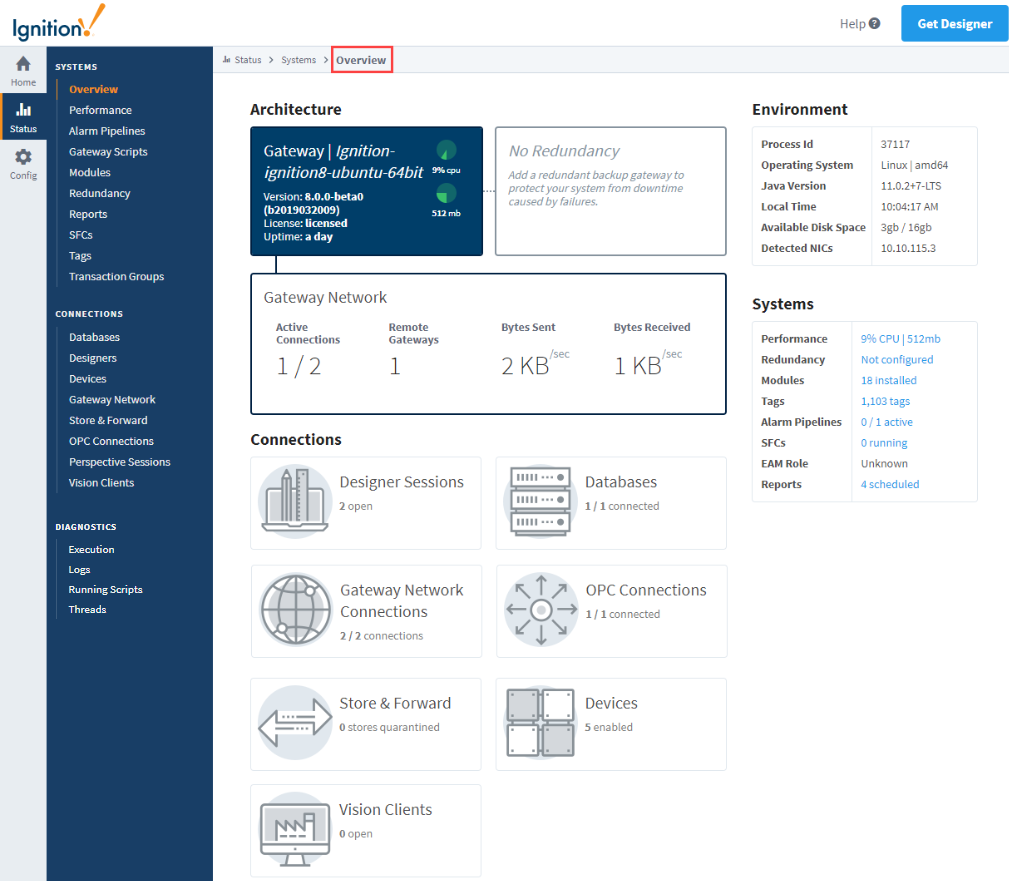
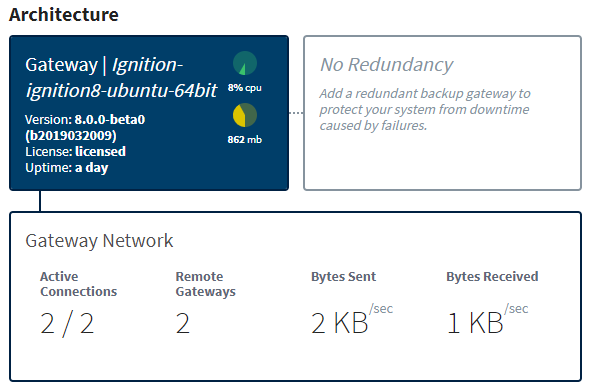
Architecture
The Architecture segment provides a top down view of your Gateway. You can see your Ignition version and resource usage, as well as similar information with a redundant Gateway, if one is connected. You also get an overview of the Gateway Network including how many active connections there are, and what is the amount of data being transferred between them.
Environment
The Environment segment provides some basic information about your server such as the Operating System (OS), Java version, available disk space, and IP address of detected network interface cards (NIC).

Systems
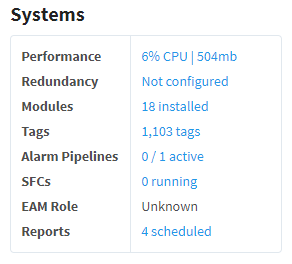
The Systems segment summarizes each of Ignition's systems. Here, you can see how many modules you have installed as well as how many Tags are configured in your Gateway, along with a handful of other information. Click on any of the linked system descriptions to find out more information about a particular system.
Connections
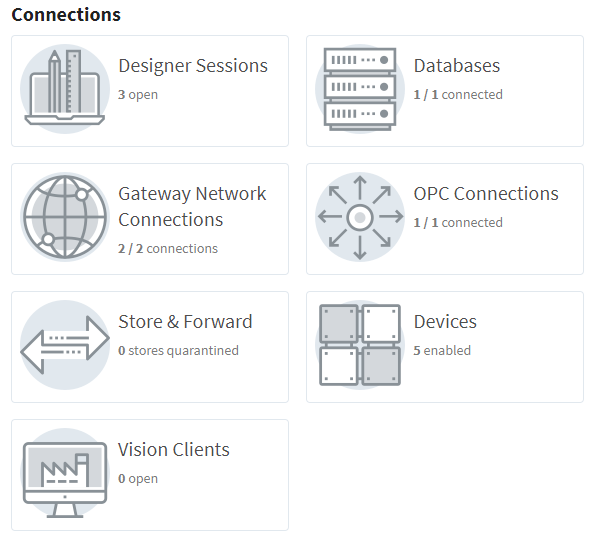
The Connections segment shows all of the systems that Ignition is connected to. If any of these have issues, they will be outlined in red. Clicked on the connection to be taken to the relevant page within the Status tab.
Performance
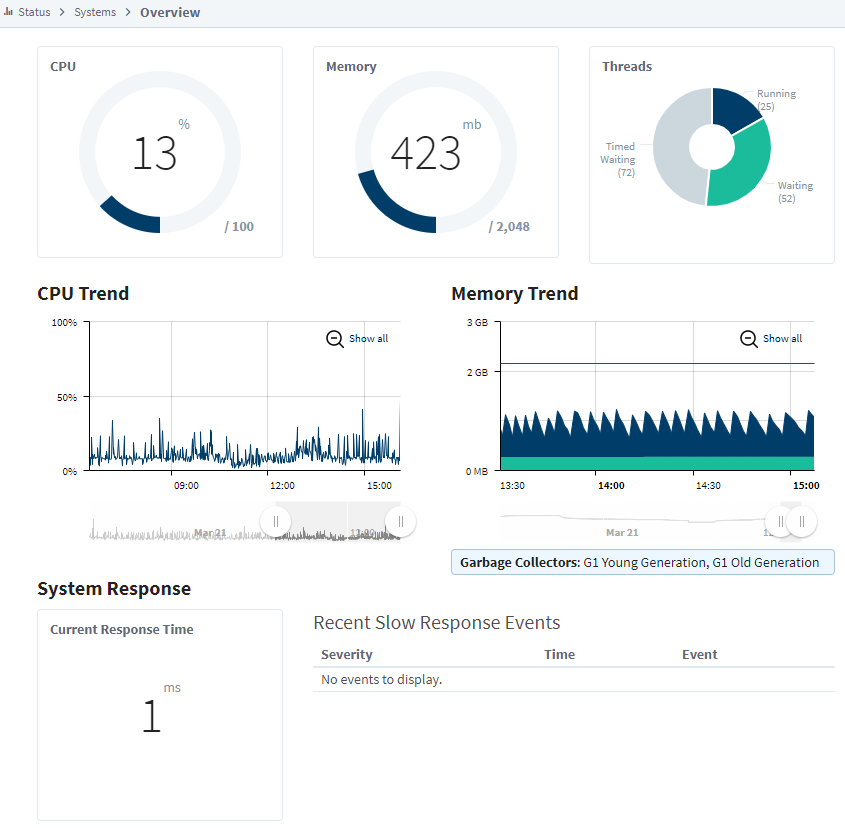
The Performance page displays information on the resource usage of the Gateway. This page enables you to quickly assess your Gateway's overall health and determine if the Gateway is being taxed too heavily for the server it's running on. You can see the current CPU usage, the current memory usage (in megabytes) out of the total allocated for the Gateway, and how CPU threads are performing. In the CPU Trend and Memory Trend sections there are sliders you can move to set the time range anywhere with in the previous 24 hours. The lower portion of the page shows the current system response time as well as a log of any recent slow response events.
Alarm Pipelines
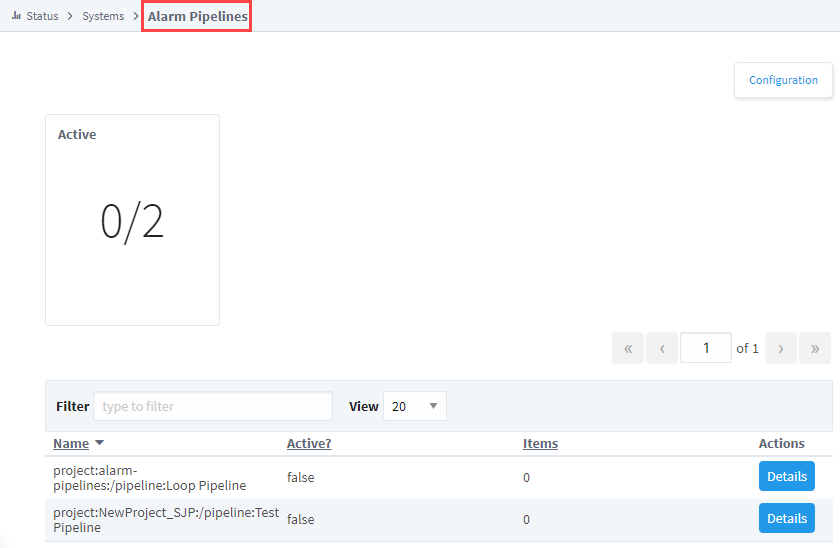
The Alarm Pipelines page lists the currently configured alarm pipelines in the Gateway. Each pipeline displays the number of alarm items currently running through it. Click on the Details button to the right to open up a new page that will show the alarm pipeline status and logs. There will also be a set of tabs at the top of the page. One for the Pipeline Status that is already open, the other for Pipeline Logs. This log viewer will act as a miniature log viewer that will only show logs that pertain to this particular pipeline.
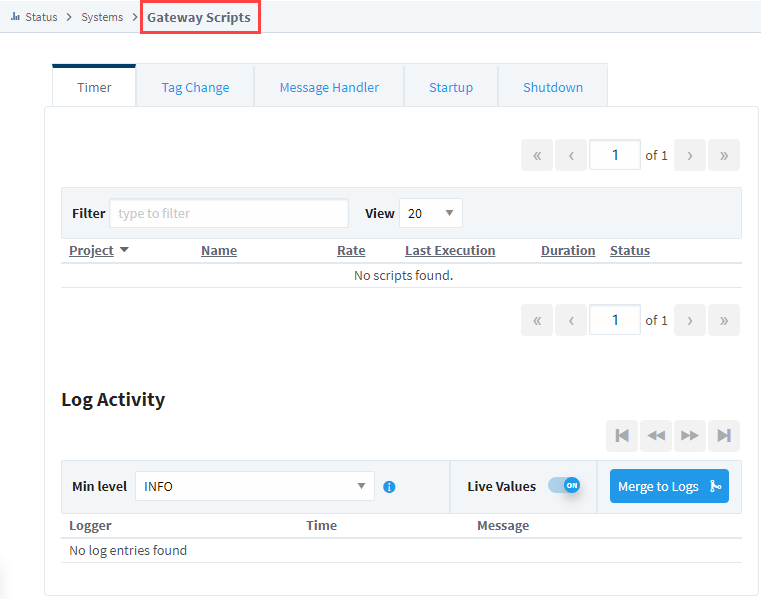
Gateway Scripts
The Gateway Scripts page displays a list of all currently configured Gateway scripts. These are scripts that are configured in the Gateway Event Scripts section of the project. The tabs at the top of the page will swap between the different types of Gateway Event Scripts: Timer, Tag Change, Message Handler, Startup, and Shutdown. They provide useful information such as the name of the project that it is running in as well as the last time it ran, the duration and status (if it was successful or not).
With this page you can quickly verify that your scripts are running properly. If a script has an error, click on the error for more details about what went wrong with the script. All of the logs for that section are also contained in the log viewer at the bottom of the page, to make it easy to see a list of all of the logged errors for that set of Gateway Event Scripts.
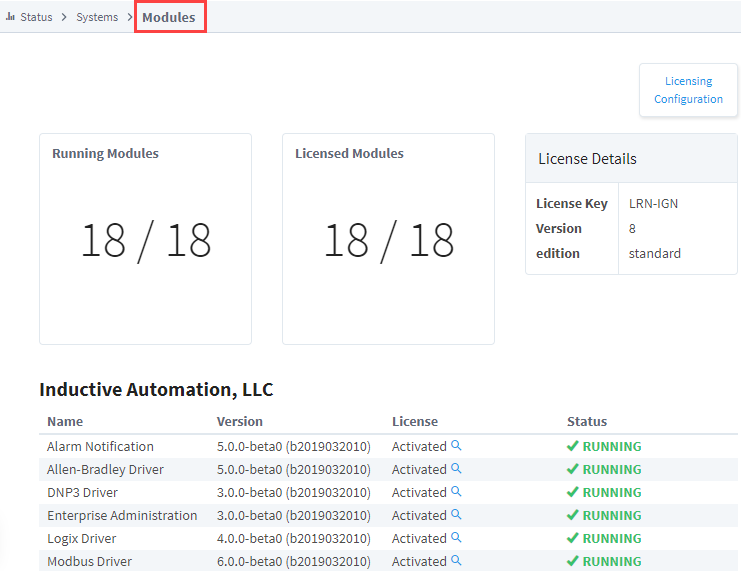
Modules
The Modules page shows a list of the currently installed modules, their current version, and if they are running properly with a license. The top of the page shows a quick count of the running and licensed modules, so you can easily tell if anything is not working. It is then easy to scroll down through the list to see which modules are having issues.
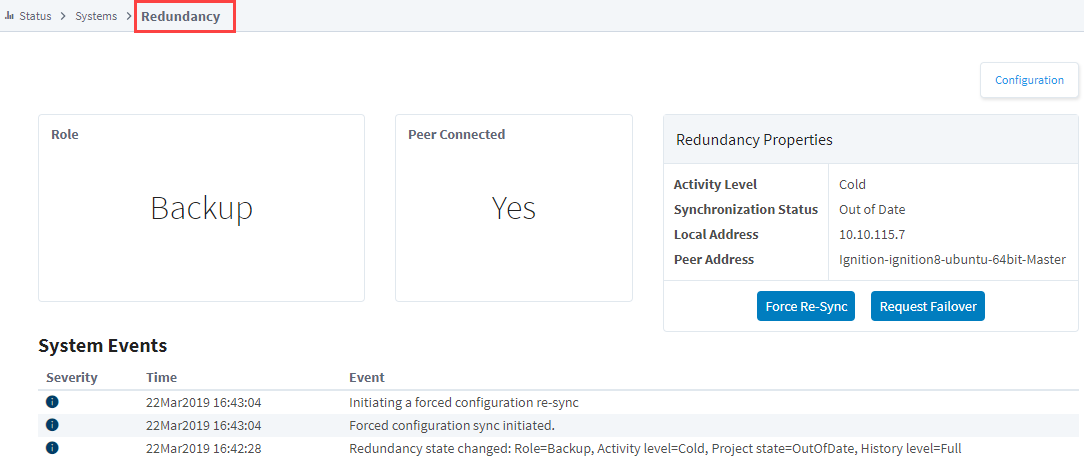
Redundancy
The Redundancy section displays information regarding the redundant system, if one is configured. It easily shows the Role of the Gateway you are viewing, the status of the connected Gateway, and their IP addresses. The trends on this page give a snapshot of the last few minutes of communication between the two Gateways. The first trend shows the data that is being sent and received between the two Gateways, the second shows the state updates that have recently occurred. The bottom of the page contains a log of the last system events, to easily track major events between the Gateways.
Force Re-Sync
The Force Re-Sync button forces a full synchronization of the redundant configuration state. The backup node will be forced to restart.
Request Failover
The Request Failover button switches the active node in a redundant pair.
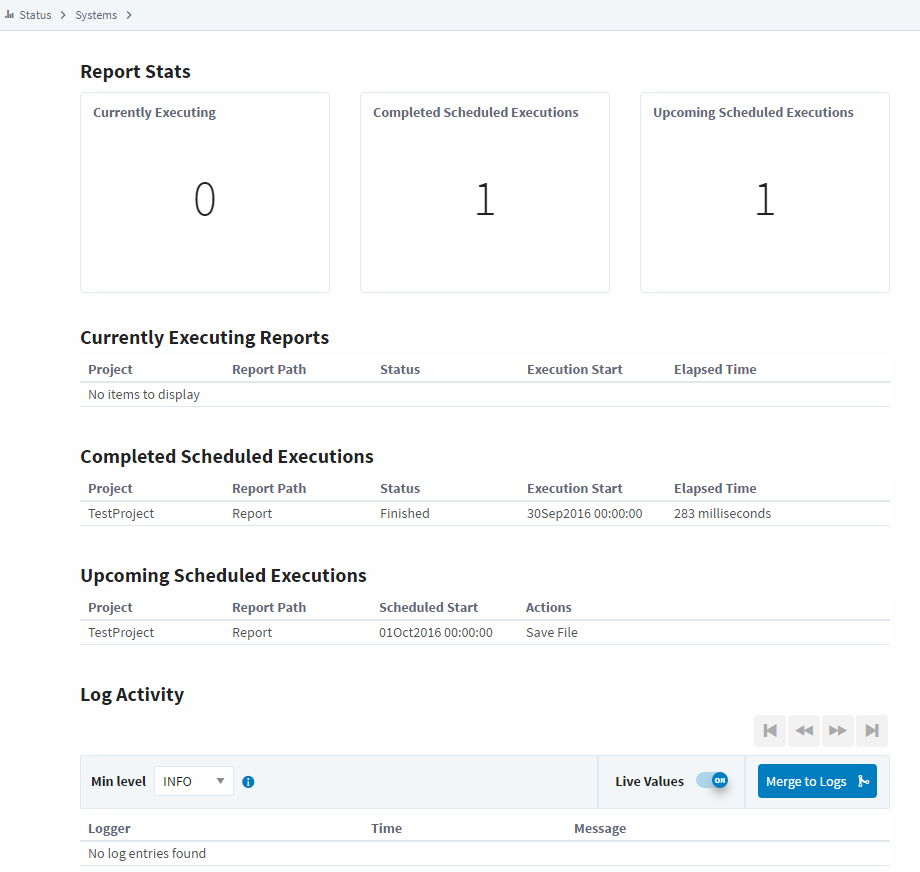
Reports
The Reports page shows information on any Reports that have at least one scheduled action set up. The top of the page gives a quick count of reports that are executing an action, have executed an action, or are going to execute an action. Below you can also find a list of Reports in those states as well, to quickly see what project they are located in, or what their last execution time was. As with most other pages, there is also a log of all events related to reports at the bottom of the page.
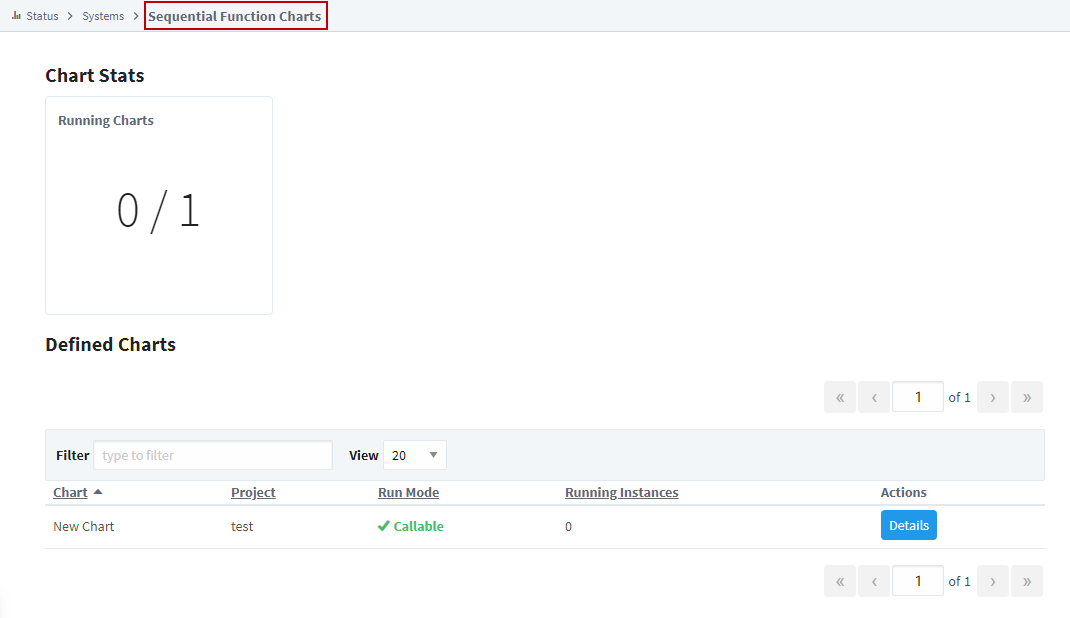
SFCs
The Sequential Function Charts (SFCs) section displays a list of all of the currently configured SFCs along with a count of the currently running charts at the top of the page. Click the Details button next to any SFC for details about that particular Chart.
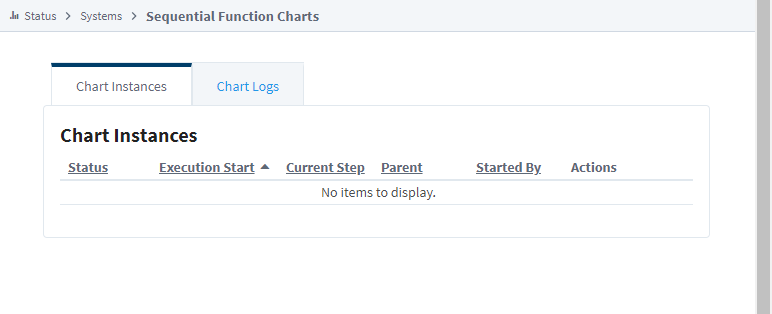
On the Details for an individual SFC, there are two tabs: Chart Instances and Chart Logs. It contains a list of all currently running Chart instances, and allows you to swap tabs to look at any logged events for that particular chart.
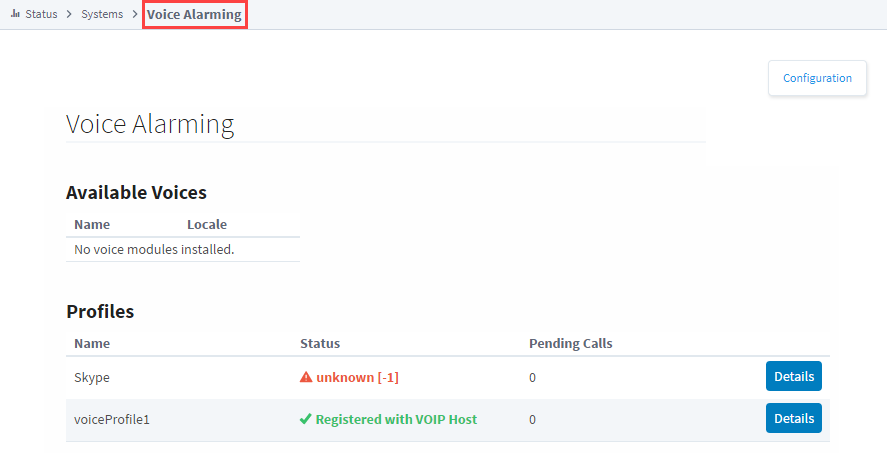
Voice Alarming
The Voice Alarming page provides details about the currently configured Voice Notification Profiles on the Gateway. This status can be used to quickly see which Notification Profiles are not working. Clicking the details button enables you to see the current calls with that Voice Notification profile and the current queue of calls waiting to be completed.
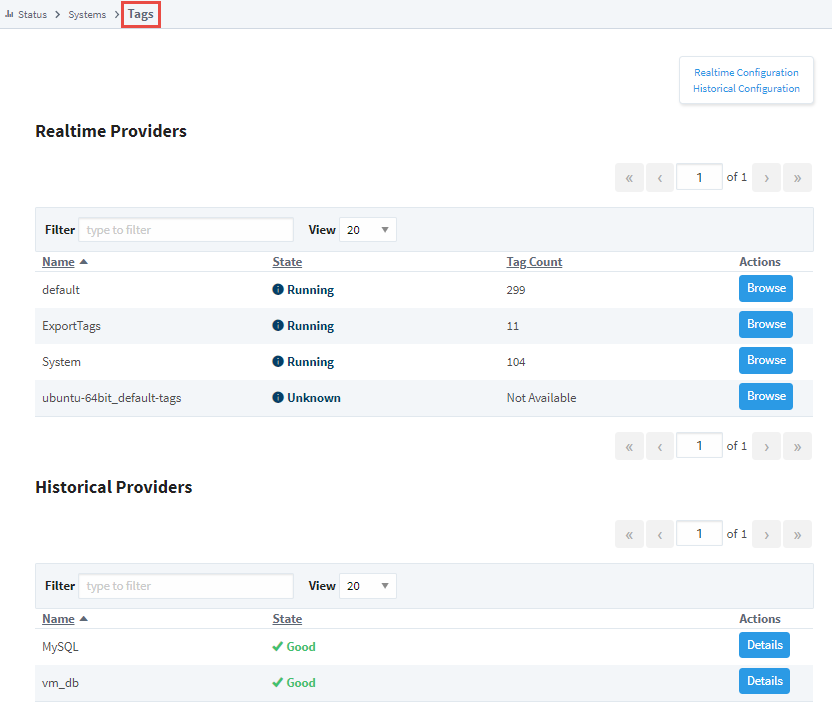
Tags
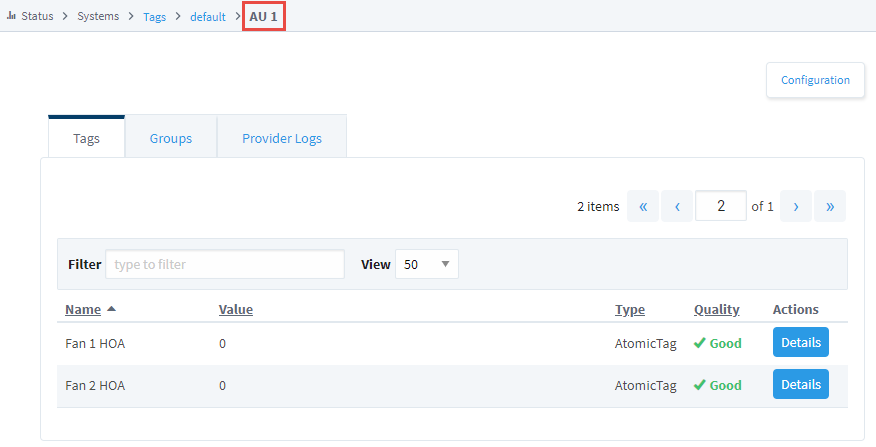
The Tags page contains a lot of information about the Gateway's configured Tags and Tag Providers. The first page will show a list of all realtime and historical Tag Providers that make it easy to see if any of them are having issues. Clicking on an errored provider will show an error message that may help fix the problem. Clicking on the Details button to the left will open up a page with more information about the Tags in that particular provider.
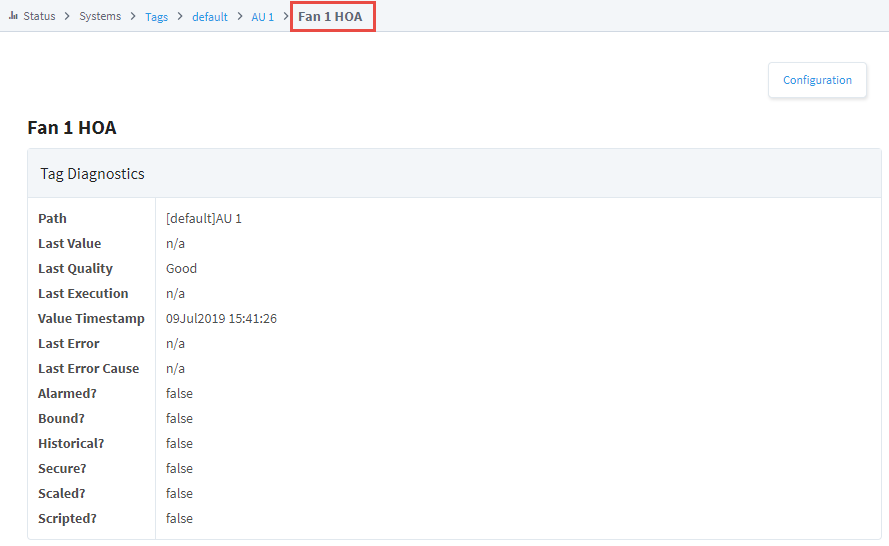
The details of the Tag Provider will show a list of all currently configured Tags in that Tag Provider, and show some basic information about them. You can browse through the Tag structure to get more information about each Tag. When clicking the Details button for an individual Tag, you will be brought to a Tag Diagnostics screen that will provide more detailed information about that particular Tag, such as if it has a script written in its Tag event scripts and what its last value was, among other information.
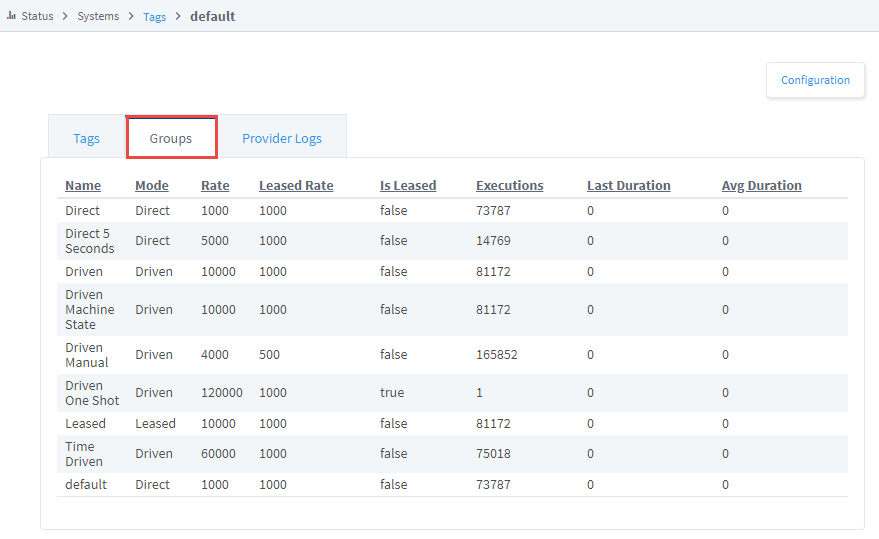
The Groups tab allows you to see the Tag Groups configured. It also shows the number of executions for each Tag Group, the last time the Group was executed and the average duration in milliseconds. Provider Logs display any events that relate to that particular provider.
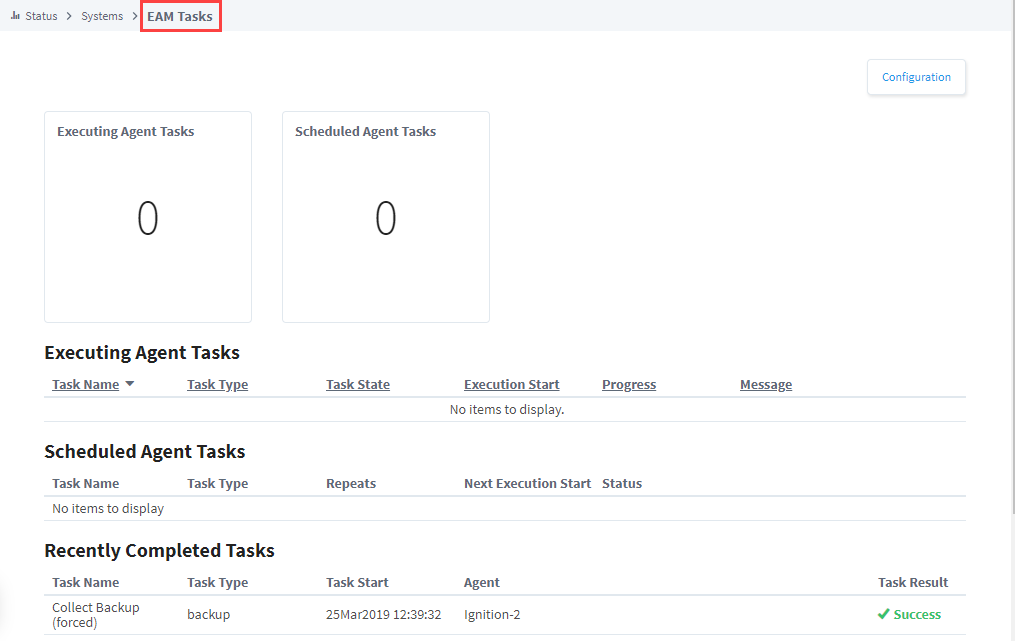
EAM Tasks
The EAM Tasks section will only show up once the EAM module is configured. This page shows information regarding the currently running and scheduled tasks, as well as tasks that were recently executed and whether they were successful or not. From here you can pause a scheduled task, or see the error that caused a previous execution to fail.
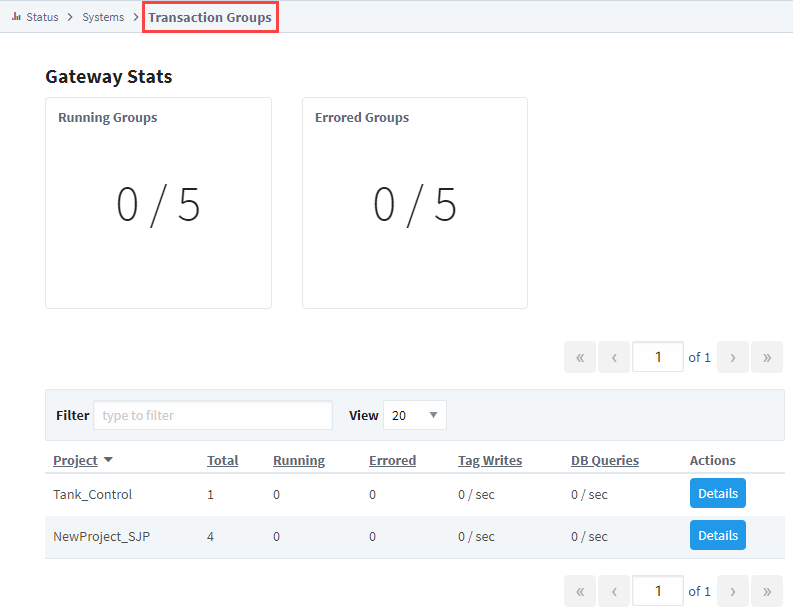
Transaction Groups
The Transaction Groups page makes it easy to get a quick count of the currently running Transaction Groups as well as the currently errored groups. Below the counts is a list of Projects that contain Transaction Groups and some basic information like how many are running and how many database queries is it generating. Clicking the details button to the right for one of the Projects brings up more information about that Project's Groups. There are some counts on the number of Groups in various states, as well as a list of the groups. Any Groups that have problems can be clicked on to see what the error is to get a better idea of why the Group is unable to run.