2. Showing Tag History in a Power Chart
Let's create a second view (i.e., SecondView) and add a Power Chart component to show history on the values of several Sine Tags.
-
Right-click on the Views > Test folder and create a new view (i.e. SecondView).
-
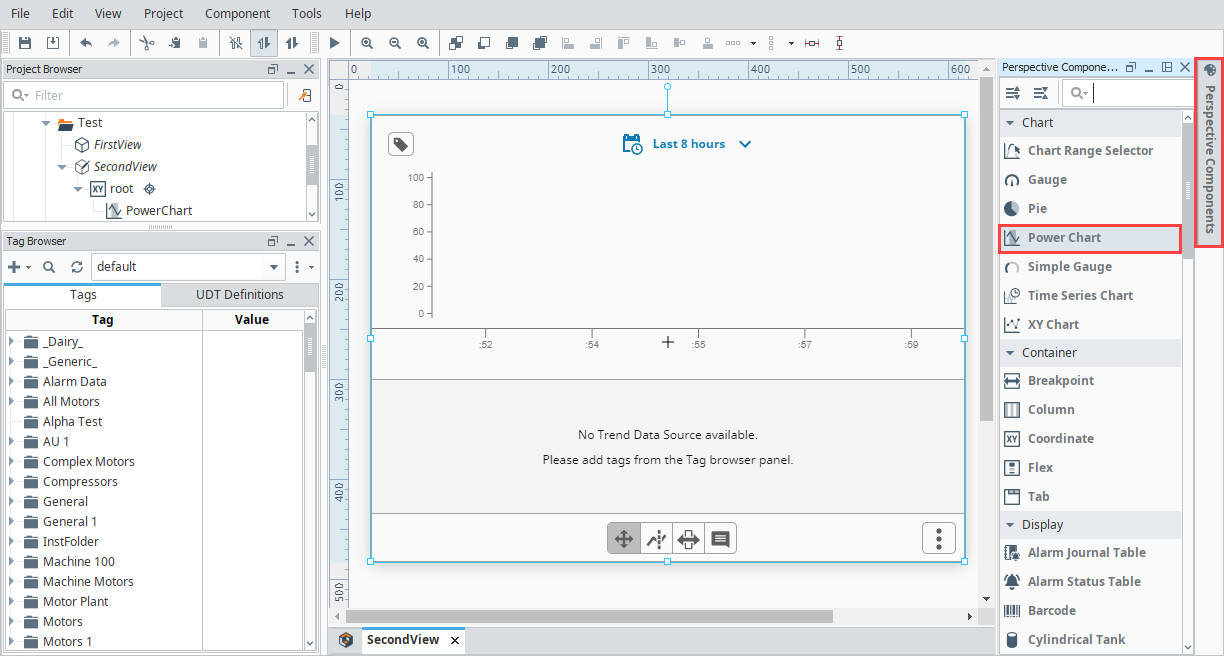
Once you have your second view created, drag a Power Chart component on to your view.
-
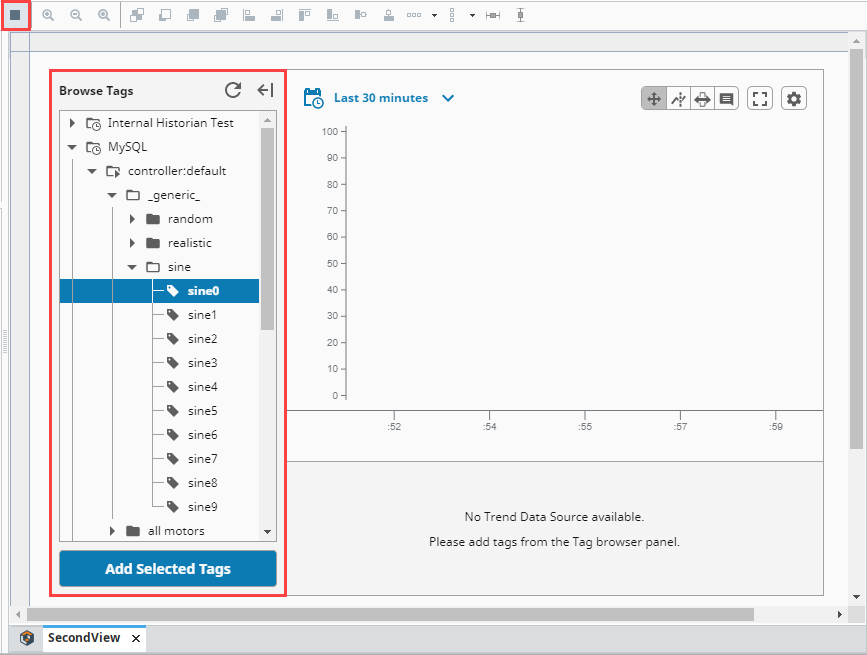
With the Power Chart selected, put your Designer in Preview Mode and click the Tags icon
 in the top left of the chart. This will open the built-in Tag Browser in your Power Chart where you can add or drag Tags into your chart.note
You will need to have Tag History configured and stored in a database on the Tags you want to add to the Power Chart. If you don't see the Tag(s) you want to add in the built-in Tag Browser, you will need to enable History on the Tag in the Tag Editor.
-
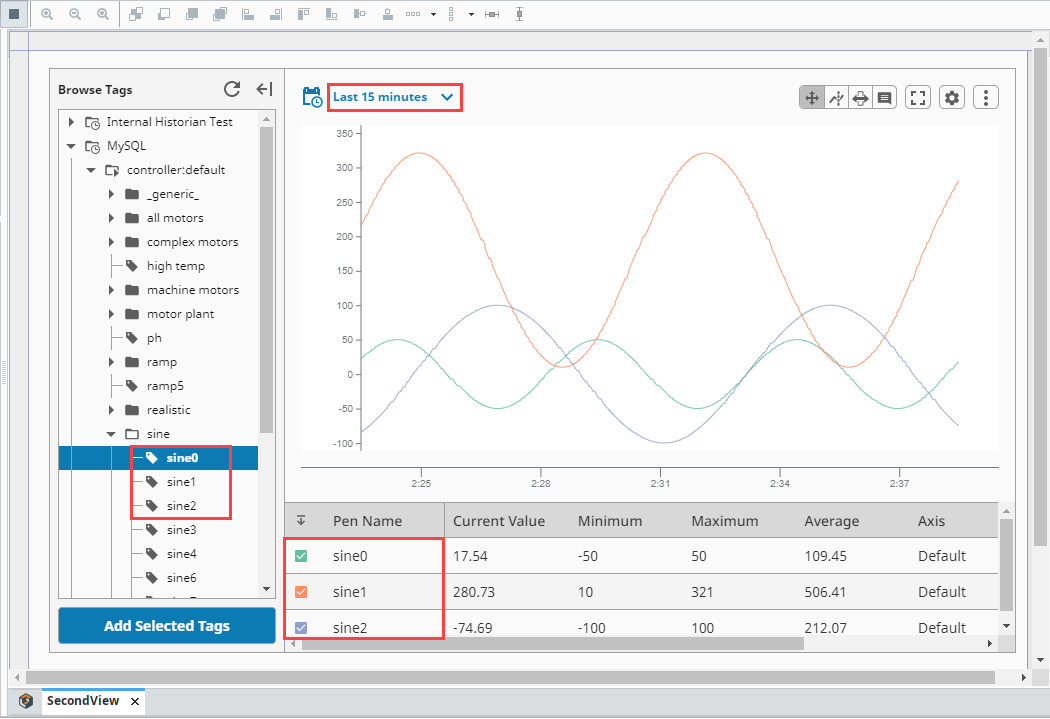
Select some tags and click the Add Selected Tags. You can also change the Time Range Selector if you want to show your tags in Realtime or Historical. In the following image, we added the Sine0, Sine1, and Sine2 tags. We also selected Realtime, and 15 minutes as our timeframe to display the Sine values on the chart.
-
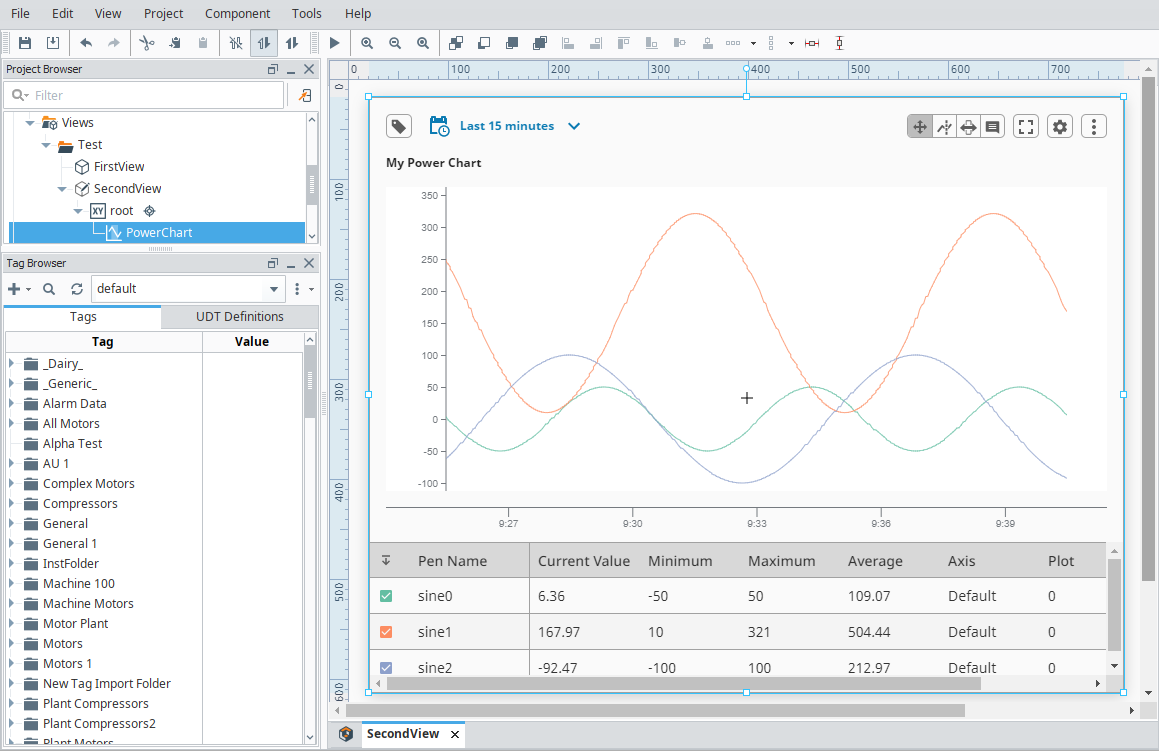
You'll notice that the Power Chart will immediately start plotting data and the tags you added are shown at the bottom of the chart. That's all it takes to create a Power Chart. The Power Chart has a host of settings to customize how you can display your data: axes, plots, time range selector, and pen styles.
noteThe Power Chart component has a responsive breakpoint so it fits better on mobile devices. The default breakpoint is 750px and is configurable. For more information, go to the Perspective Power Chart page.
-
Save your project by selecting File > Save.