Tutorial - The Report Workflow
There are three fundamental steps to creating Reports:
- Gather Data
- Design the Report
- View or Schedule Delivery
This tutorial provides a walkthrough of creating a simple report and reinforces some of the concepts and terminology involved. If you are already familiar with the basics of how to create a Report, you may be interested in the Reporting Reference in the Appendix.
Creating Your First Report
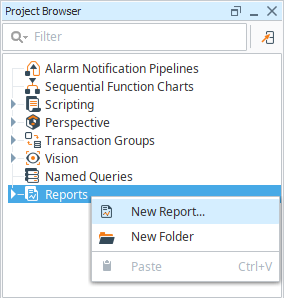
To create your first report, you will need the Reporting Module installed. Once installed, launch the Ignition Designer to get started. To create a new report, right-click on the Reports node in the Project Browser, select New Report, and enter a name for your report.
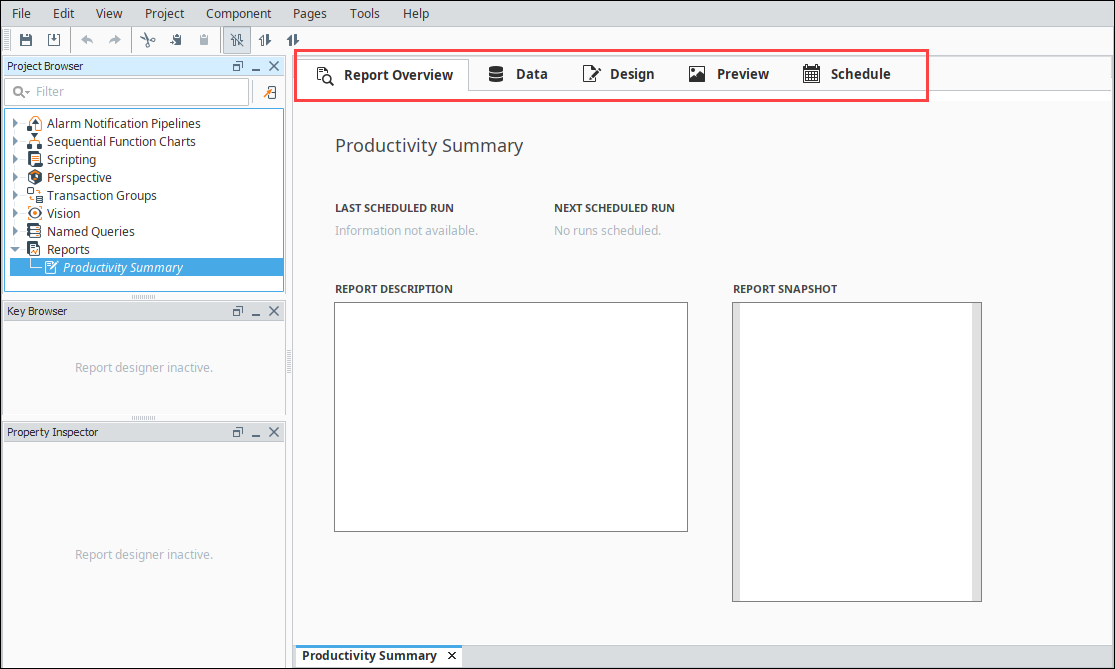
The Report Workspace will open, and you'll be in the Report Overview Panel. The top of the workspace has a series of stylized panels that guide you through the creation of a new report. The Report Workspace is formatted to follow the three fundamental steps to creating reports:
- Gathering data
- Designing reports
- Setting up schedules to run and distribute reports
Setting Up Data Sources
For any Report, you will first need to specify one or more data sources in the Data panel.
-
Click the Add
 icon to add the Static CSV data source. If you would like to use data from a database connection instead, feel free to add a SQL Query data source instead.
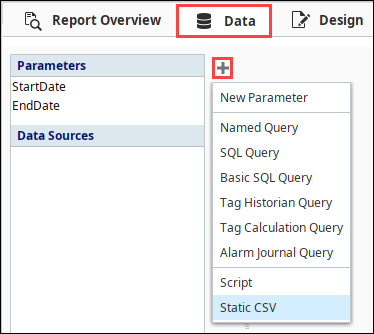
-
With the Static CSV Data Source editor open, copy and paste the CSV data below into your Data Source editor
-
Enter a name in the Data Key field. We named ours WidgetProduction Data since this example models data collected from all the International Widget Factories, complete with production capacity, number of widgets produced, and the number of minutes it took to produce them.
Static CSV Data SourceFacility, Capacity, Produced, Minutes
"California", 2000, 665, 345
"Texas", 3424, 1674, 924
"South Africa", 734, 232, 154
"Brazil", 1131, 882, 325
"China", 5324, 2764, 297
"Norway", 436, 143, 383
"Kenya", 1431, 423, 164
"Italy", 543, 524, 234
"Romania", 154, 78, 45
"Peru", 624, 523, 732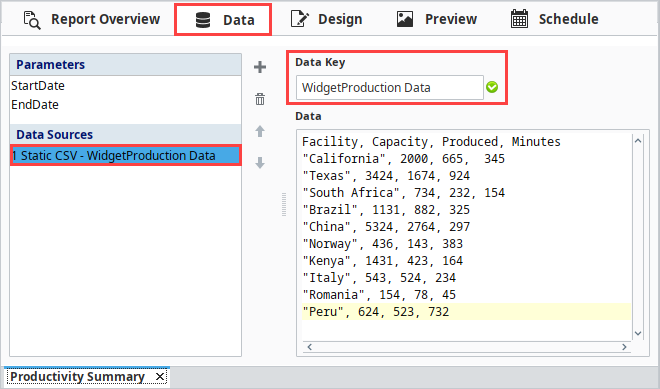
-
Go to the Design panel and expand the Data Sources folder in the Key Browser.
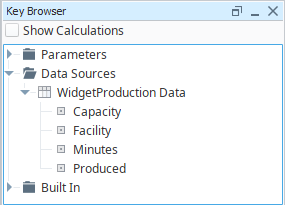
Now that you have some data, you'll see that each column of data in the Static CSV data source is represented by its own Data Key. These Data Keys are automatically generated based on the table of data fed to the report system. A key may have subkeys, or child-keys. Accessing the data from a child-key is accomplished by using the path of a key in relation to its parent, sometimes referred to as a Keychain. A Keychain is the path to your data key using 'dot notation'. For instance, the Keychain dragged into a report for our Facility key would be @WidgetProduction Data.Facility@.
You can have multiple keys in any text field. In addition, you can use multiple keys and common numeric operators to do calculations within the @ symbols. These are called Keychain Expressions.
Next, let's create a design and see how the Data Keys can be used to create dynamic reports.
Design the Report
The Design Panel is where we start building the report. This section of the report has many components, such as tables and charts, that can display the results of your data sources and parameters. Components in a report are typically assigned one or more keys, which then feeds the results of our data sources and parameters directly to the component. To create comprehensive reports, you will likely find yourself combining different components.
For this report, we will aim for the following requirements:
- A Table that gives a summary of how many widgets each factory produced, and the totals for each data column.
- Factory efficiency on a units/minute basis which needs to be calculated.
- A Header/Title for the report.
- Page numbers in case the report gets to be too long.
- A Bar Chart that visualizes widget production. This will use a separate data source that summarizes the Table's data.
Adding a Table
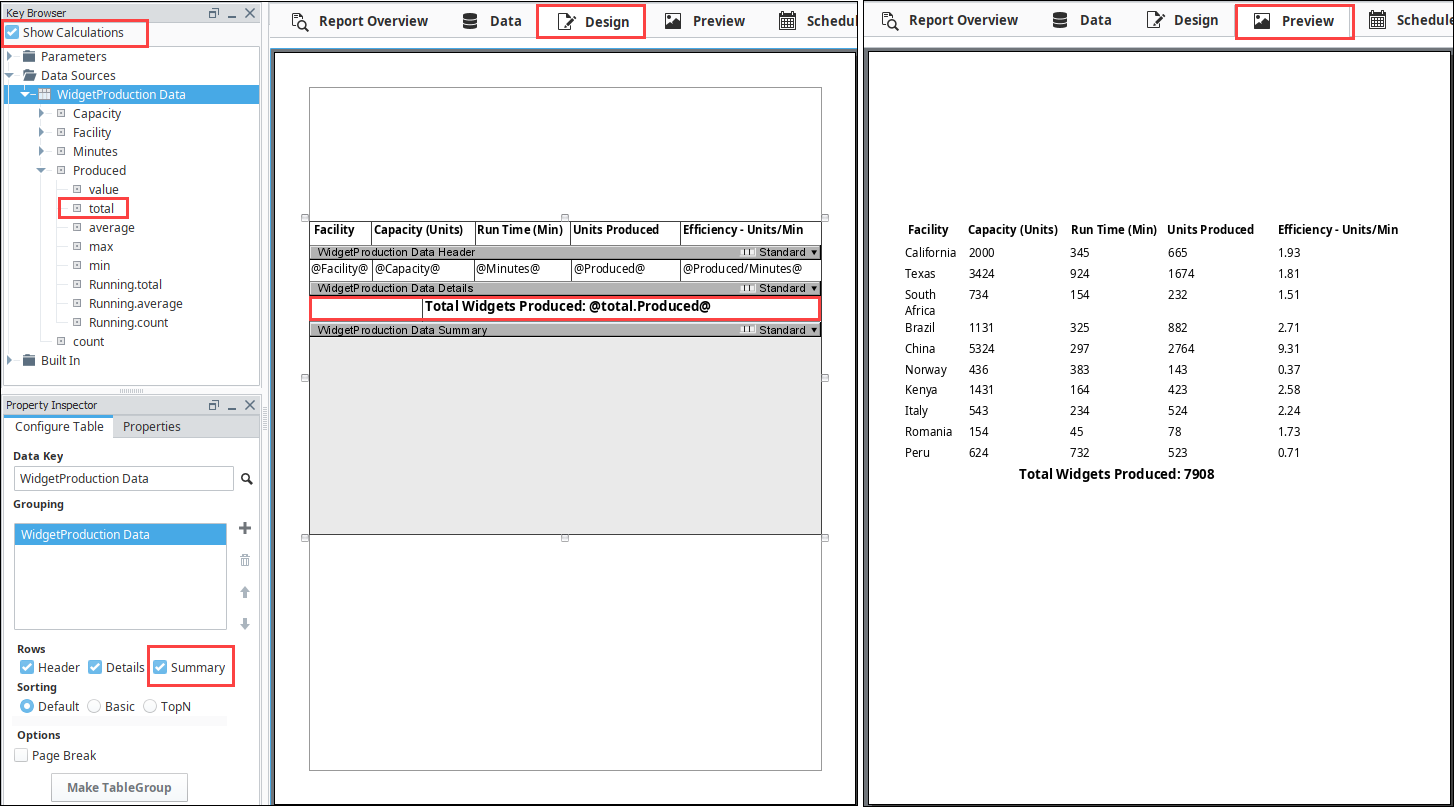
-
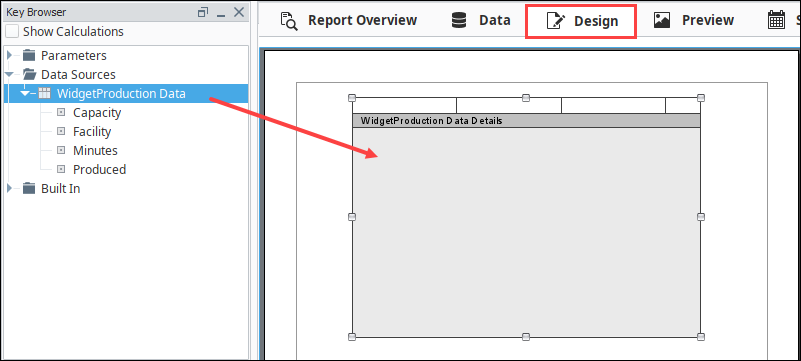
In the Design panel, drag and drop the WidgetProduction Data key from the Key Browser onto the page. When you let go of the mouse button, this will create a Table component.
-
With the Table selected, in the bottom left corner of the Property Inspector, you will see the Configure Table tab. Note that the Data Key property on the Table was automatically assigned to our WidgetProduction Data data source. Additionally, you'll see the Details Row (the dark gray bar on the Table component) displays the name of our data source.
tipAlternatively, you may drag a Table component from the Component Palette on the right side of the interface. If you take this approach, you must manually assign a data source by interacting with the Data Key property on the Configure Table tab. Clicking the search
 icon next to the Data Key property will allow you to assign a data source. If you are following this option, it's important to select a data source immediately.
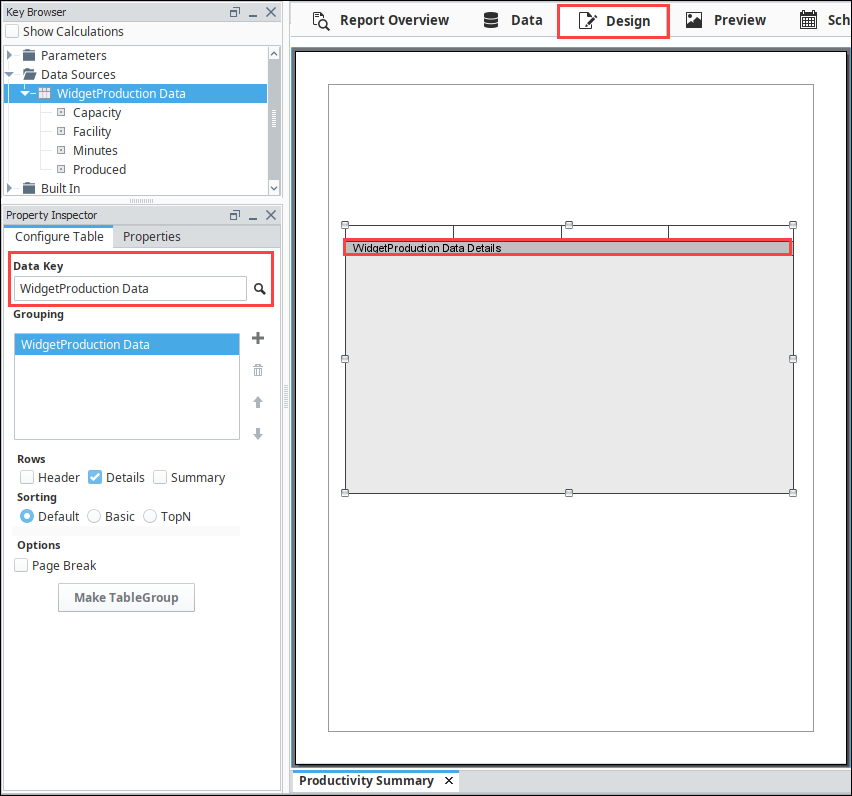
Configuring Data for your Report
Now, let's add some keys to the Table.
-
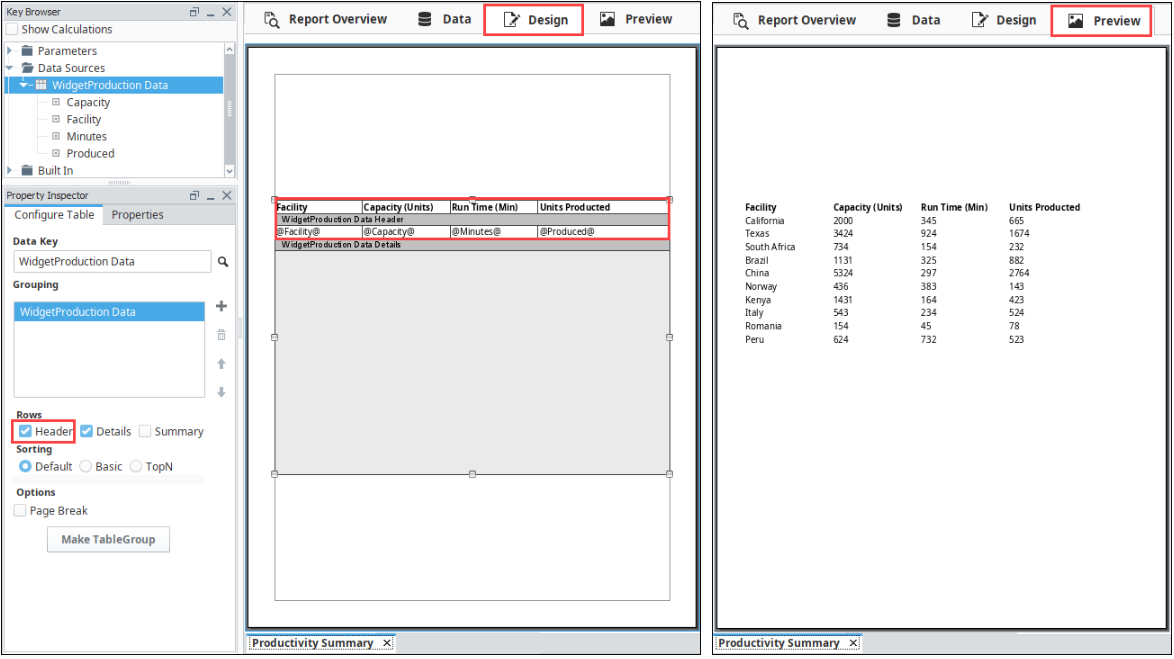
In the Design panel, drag and drop data keys from the Key Browser (i.e., Facility, Capacity, Minutes, Produced) into the Details columns. You'll notice the keys you dropped are surrounded by '@' symbols. The @ symbols tell the report engine that text inside is a key, and it will look for the key's value when the report is generated.
-
Add a header for each of the columns by selecting the Header checkbox under the Configure Table tab of the Property Inspector.
-
Select each header column, type in your header name. Optionally, you can make it bold in the Text Editor pane.
-
Go to the Preview panel to check the data in your report.
Let's take it a step further. Say you would like to calculate the efficiency of units produced per minute of production runtime. You can use the keychain expression @Produced/Minutes@, which will return the value of the Produced key divided by the value of the Minutes key. Note that this calculation is executed for each row, so it is always taking the current rows values to determine the quotient. To do this, you need to add another column in the Details Row and Header Row with the following steps:
- With the Table selected, double-click the Details Row. This opens the Property Inspector containing all the Details properties.
- Under the Properties tab, change the Column Count property from '4' to '5'. The new column will be added on the right side of your Table.
- Adjust the column width to make it visible since new columns default to a width of 0.
- Click on the new cell and enter '@Produced/Minutes@'. Refer to the screenshot in the Design panel below.
- Double-click the Header Row and add a column by changing the Column Count property from '4' to '5'.
- Adjust the new column width to make it visible.
- Enter 'Efficiency - Units/Min' in the new Header column.
Lastly, let's add a total for the number of widgets produced from all facilities to your report using the following steps:
-
With the Table selected, select the Summary checkbox in the Configure Table tab of the Property Inspector. A new Summary row will appear.
-
Double-click on the new Summary Row, and under the Properties tab, change the Column Count property from '4' to '1'.
-
In the Key Browser, set the Show Calculations property to 'true' making the Built-in keys available.
-
Expand the Datasources > WidgetProduction Data > Produced object. Drag the 'total' key from Produced to the second column of your new Data Summary row.
-
Select the cell you just added to and type the following text in front of your key: 'Total Widgets Produced'. In the Text Editor you can also make it bold.
noteIn this example, we also navigated to the Properties tab of the Text Editor and changed the Horizontal Alignment property to Center.
-
Go to the Preview panel to check your report. You should see all your data in the report.
Adding a Header, Date, and Page Numbers to a Report
Header
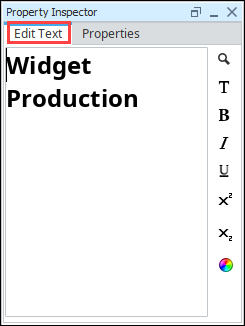
The Text Shape is great to use for a report title, although it can be used anywhere in the report to add text to the page.
- To activate, click on the Text Shape
 icon on the Component Palette.
 - Once selected, click and drag on the top of the page to create a Text Shape.
- Give your report a title by typing into the field of the shape.
You'll notice the Edit Text tab in the lower left corner of the Property Inspector, along with some buttons that let you customize the look and layout of the text. This configuration area will change depending on the selected component on the report. In the same area, you'll notice there is a tab titled Properties. The Properties tab provides access to a component's various properties. Feel free to experiment with the settings, like font, to customize your title and text shapes.
Date and Page Numbers
In addition to a title, let's add some metadata, such as the date the report was generated. Adding text on a page shared with a repeating component (such as a Table) will add the text to all pages created by the component. In some cases, like page numbers, date, and title at the top, this is desirable. Note that you don't want to simply type the date into the text field because all reports you run (could be today, tomorrow, or next year) will show what date you typed. Instead, you want the date to reflect the day the report was generated.
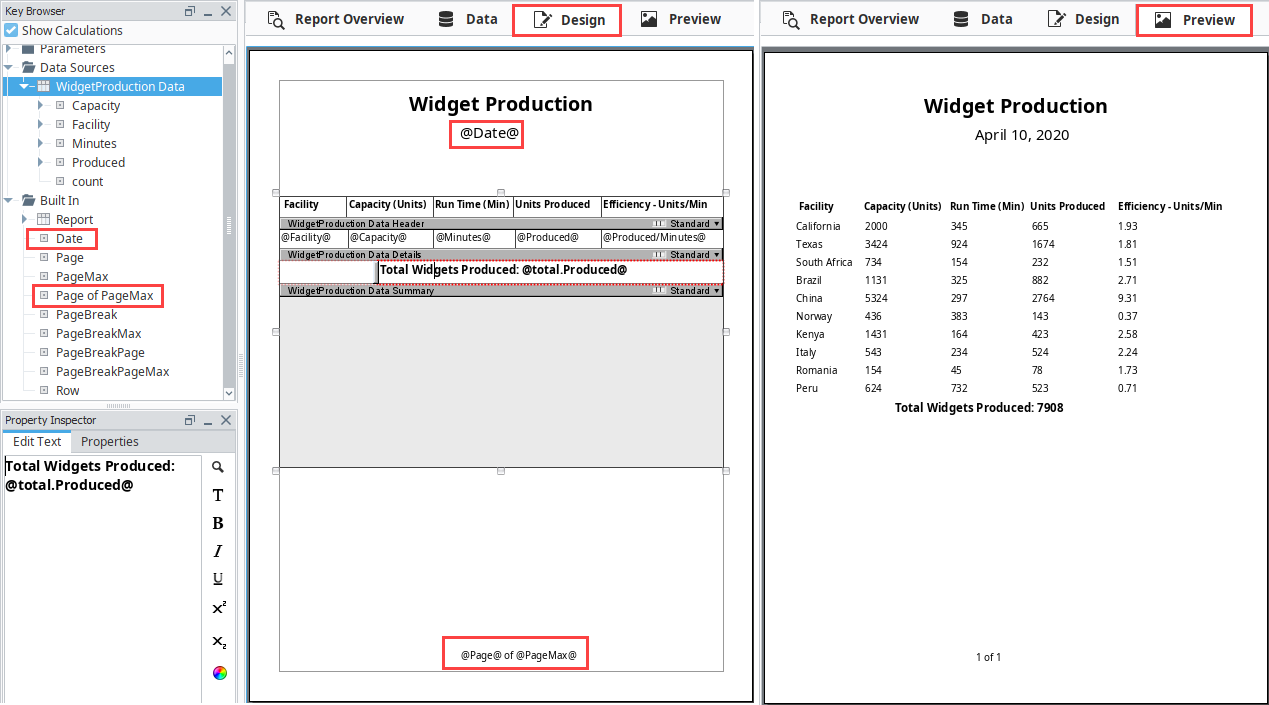
- If you look at your Key Browser, you'll see a folder called 'Built In'. Expand this folder and you'll see a number keys that are common in reports.
- Drag the 'Date' key and drop it on the report just below your title. This key represents the date and time the report is executed.
- By default, Text Shapes initially show just the date, but this can be modified using the Date Format property, which is located under the Properties tab when the Text Shape is selected. This example will use the default Date Format.
- Drag the 'Page of PageMax' key to the bottom of your report.
- Select the Preview panel to see how the header, date, and page numbers all appear on the report.
Adding a Chart to the Report
To finish the report, we just need to add a chart. You may need to resize the Table a little bit and add a chart right under the page header.
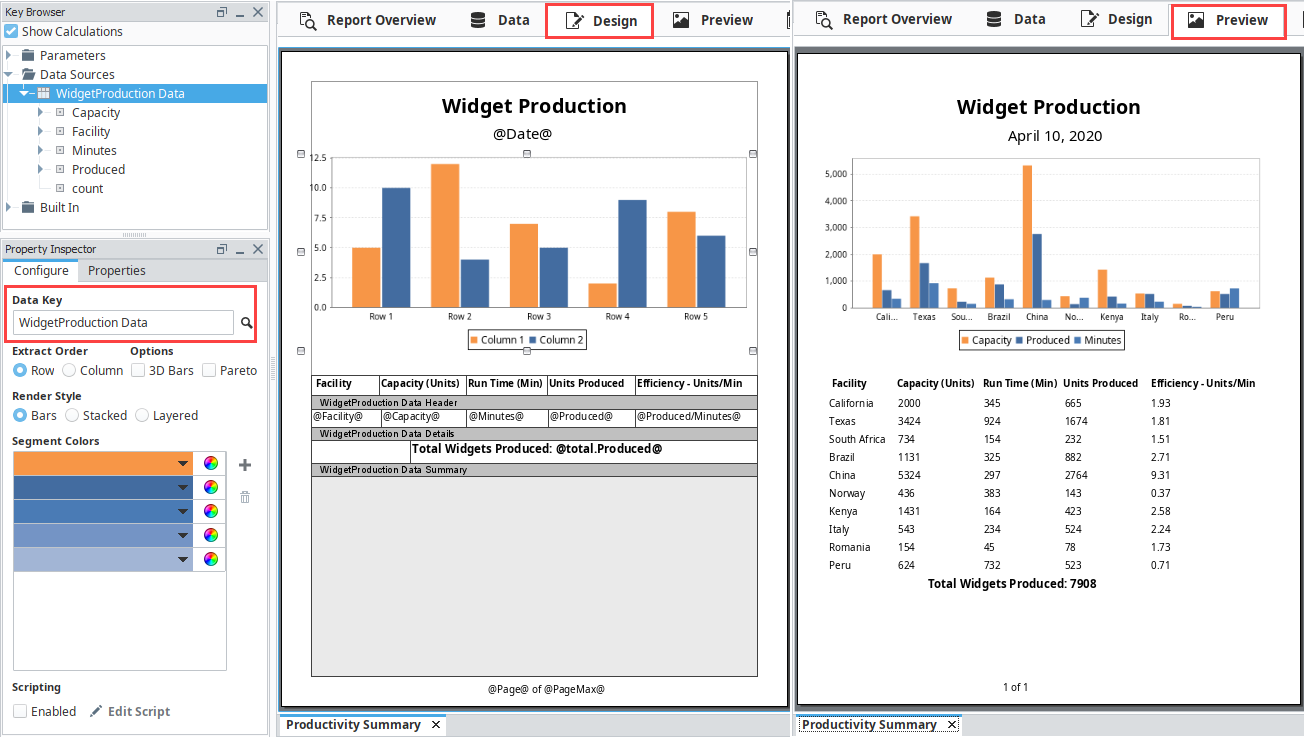
- In the Design panel, drag a Bar Chart component from Report Palette into the space above the Table. You will need to resize the Bar Chart and the Table to your report page.
- Drag the Data Source (i.e., WidgetProduction Data) from the Key Browser to the Data Key on the Configure tab.
- Go to the Preview panel to see how your report looks.
Instantly, you'll notice the Bar Chart adds a bar for each column in the data, where our goal for this report is to only show the number of widgets produced. If you want to change the colors of the bars, go back to the Design panel and edit the Segment Colors under the Configure Tab.
Viewing Reports in Runtime
Once your report is created, you can view the report from the Ignition runtime or Preview Mode of the Designer with the Report Viewer component. You can add the Report Viewer component to any Perspective View and Vision window. In Perspective, enter source path for the report by doing a copy path on the report. In Vision, select the name of your report from the Report Path parameter dropdown. To learn more, refer to Perspective Report Viewer and Vision Report Viewer pages.
To save a report from the Report Viewer, right-click on the report in the Ignition runtime or Preview Mode of the Designer, and select the format you wish to save it as. Selecting from the menu will open a Save or Print dialog in the Client window and in Preview Mode.
In Perspective, you have the option to download a report to your local device or print a report to your local printer using the built-in controls at the bottom of the report.
Creating a Schedule
Once a report is designed, you can have a list of scheduled times and actions that will execute automatically at specified times using the Report Schedule functionality.
Use the following steps to create a schedule for your report:
- In the Schedule panel, click on the Add icon on the right side of the panel. A new row is added to the Table. You'll notice the user interface is split into two sections. On the top is a Table which contains a list of all the schedules for your report as well as the Actions that will occur following report generation.
- Select a row in the Schedule section. Once the row is selected, the Schedule section becomes editable. The UNIX Crontab format is used to setup schedules.
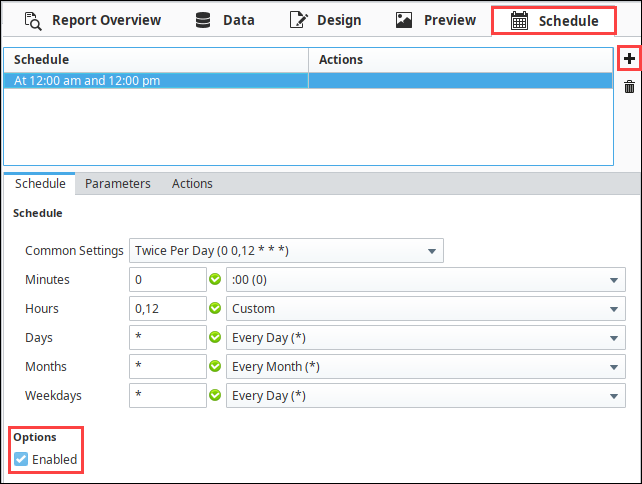
- Select a schedule from the Common Settings dropdown list and use the selection fields below to customize your schedule. In this example, the Hours dropdown was set to Every 12 hours (*12), which will run the report daily every time the current hour changes to 12 (i.e. midnight and noon).
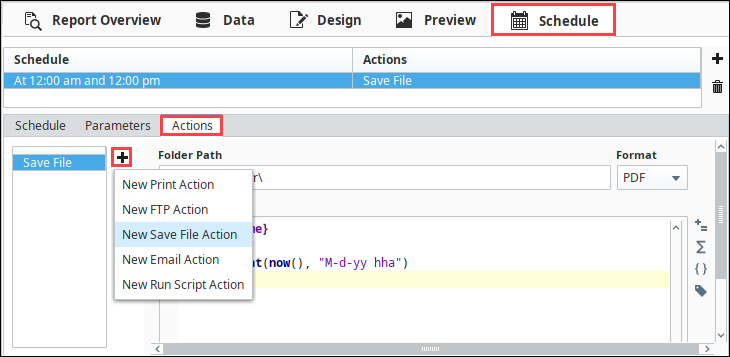
Now that a schedule has been created, we need to specify an Action to occur at the scheduled times.
Scheduling a Save Action
The Save File Action saves a copy of the report to any folder Ignition has access to whether it's on your local computer or a shared drive.
Here are a few simple steps to saving a report:
- In the Schedule panel, create a Schedule to automatically save a report by clicking on the Add icon if you don't already have one.
- Click on the Actions tab.
- Click on the Add icon and select New Save File Action from the dropdown list.
- Enter the Folder Path where you want to save your report to. You can save them to your local computer or a shared drive. This path is always relative to the Gateway, so you should always take the Gateway server's operating system into consideration when specifying the path. Below are a couple of examples of a folder path for a local computer and a shared drive:
- C:\Reports\
- Share_Drive\Folder\
- Select the file Format from the dropdown list that you want to save the report as. PDF is a common format.
- By default, your file will be saved with your report name followed by month, day, year, and hour. If you prefer not to use the default filename, you can change it.
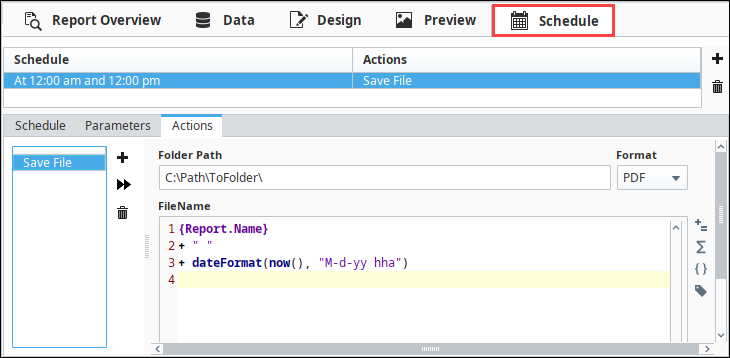
- Save your project. Your schedule is now configured and you can test out the action by clicking on the Run Immediately
 icon
icon
Disabling the Schedule
Now that your schedule is complete, you may want to disable the schedule so that a new copy of this example report is not created every 12 hours. The Schedule tab has an Enabled checkbox to allow or prevent the schedule from occurring.