Tag Calculation Query
Tag Calculations are executed by the Tag Historian, providing multiple calculated values for each Tag path. While the Tag Historian Query returns a history of values and only uses the aggregates to perform calculations on small chunks of data in the range of time, the Tag Calculation Query will aggregate, or run calculations, on the entire range to produce a single, calculated value per Tag Path.
Assuming the following configuration:
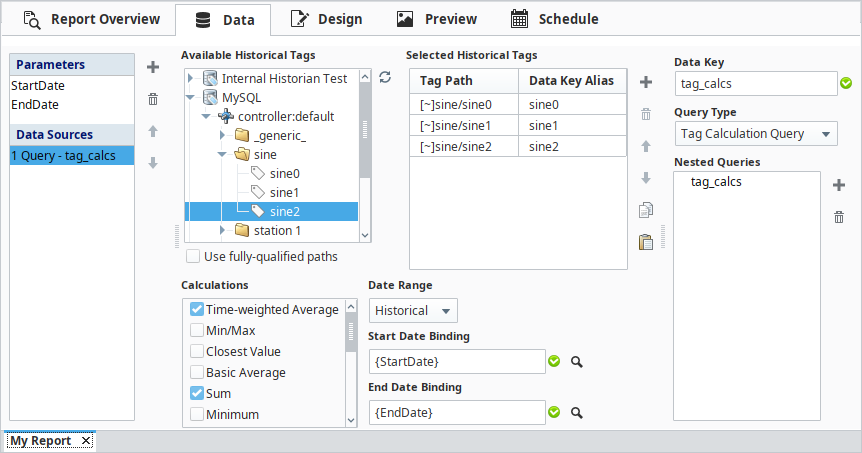
We could show the query results on a table and view the following in the Preview Panel:

| Average | Sum | Tag Path | Timestamp |
|---|---|---|---|
| 0.28 | 1601.21 | sine0 | Mar 10, 2020 |
| 165.56 | 1260330.57 | sine1 | Mar 10, 2020 |
| 1.07 | 6024.47 | sine2 | Mar 10, 2020 |
Tag Historian vs Tag Calculation
When deciding between a Tag Calculation Query and a Tag Historian Query, the main difference between the two is as follows:
- The Tag Calculation Query will always return a single row for each Tag Path, with multiple columns for each aggregate/calculation, except in the case of Min/Max (see below).
- Multiple calculations may be called on each Tag Path. This is not possible with a single Tag Historian Query.
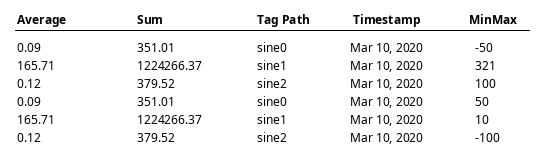
The 'Min/Max' Exception
Since Min/Max returns two values (the minimum and maximum value over the range), this calculation will generate two rows per Tag Path. This extra row will appear in the underlying data, even if the MinMax key isn't used in a table or chart, as it is part of the underlying data.
If we added Min/Max to our example above, the preview panel would look like the following:
| Average | Sum | Tag Path | Timestamp | MinMax |
|---|---|---|---|---|
| 0.09 | 351.01 | sine0 | Mar 10, 2020 | -50 |
| 165.71 | 1224266.37 | sine1 | Mar 10, 2020 | 321 |
| 0.12 | 379.52 | sine2 | Mar 10, 2020 | 100 |
| 0.09 | 351.01 | sine0 | Mar 10, 2020 | 50 |
| 165.71 | 1224266.37 | sine1 | Mar 10, 2020 | 10 |
| 0.12 | 379.52 | sine2 | Mar 10, 2020 | -100 |
The other calculations (Average and Sum) are simply duplicated for both MinMax rows.