Designer Diagnostics
The Help menu in the Designer has a Diagnostics ![]() option, which displays the Diagnostics window with tabs for six different troubleshooting features.
option, which displays the Diagnostics window with tabs for six different troubleshooting features.

The information accessed through Designer Diagnostics is specific to the client runtime or the session. For Gateway statistics, see Diagnostics - Logs.
Performance Tab
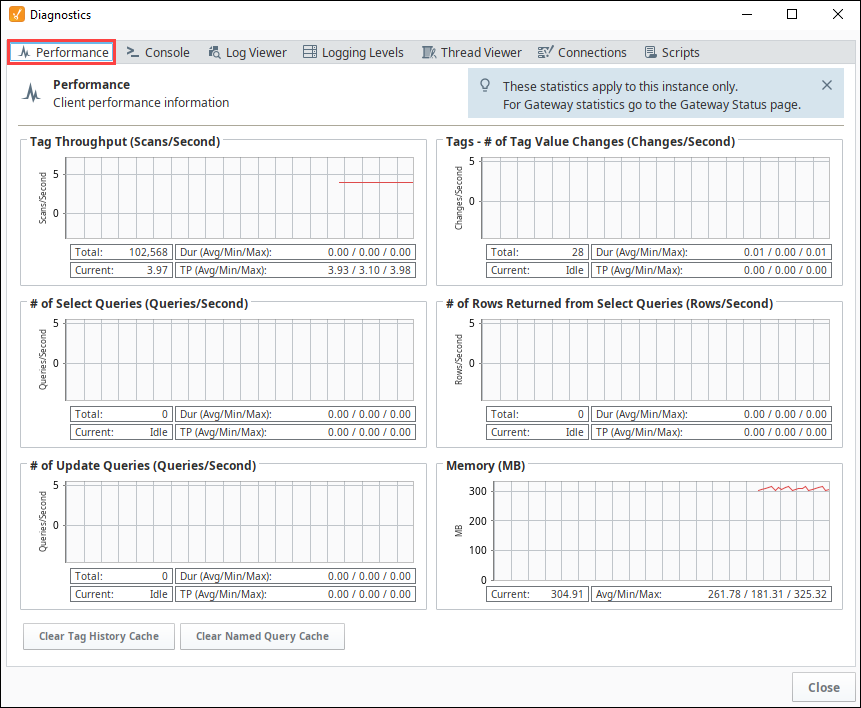
The Performance tab displays six realtime charts, each showing an aspect of the current client's performance. These charts can be very useful to help troubleshoot performance issues, especially slow queries.
- Tag Throughput (Scans/Second) - Displays the Tag throughput in scans per second.
- Tags - # of Tag Value Changes (Changes/Second) - Displays the number of Tag changes in changes per second.
- Select Queries (Queries/Second) - One of the most common causes of query slowdown is simply running too many queries too frequently, and the # of Select Queries (Queries/Second) chart can help identify when this is occurring.
- Rows Returned from Select Queries (Rows/Second) - Displays the number of rows returned from selected queries in rows per second.
- Update Queries (Queries/Second) - Displays the number of update queries in queries per second.
- Memory (MB) - Displays the client's memory usage in megabytes. This will almost always be a saw tooth pattern since memory is used, discarded, and re-acquired on a regular basis.
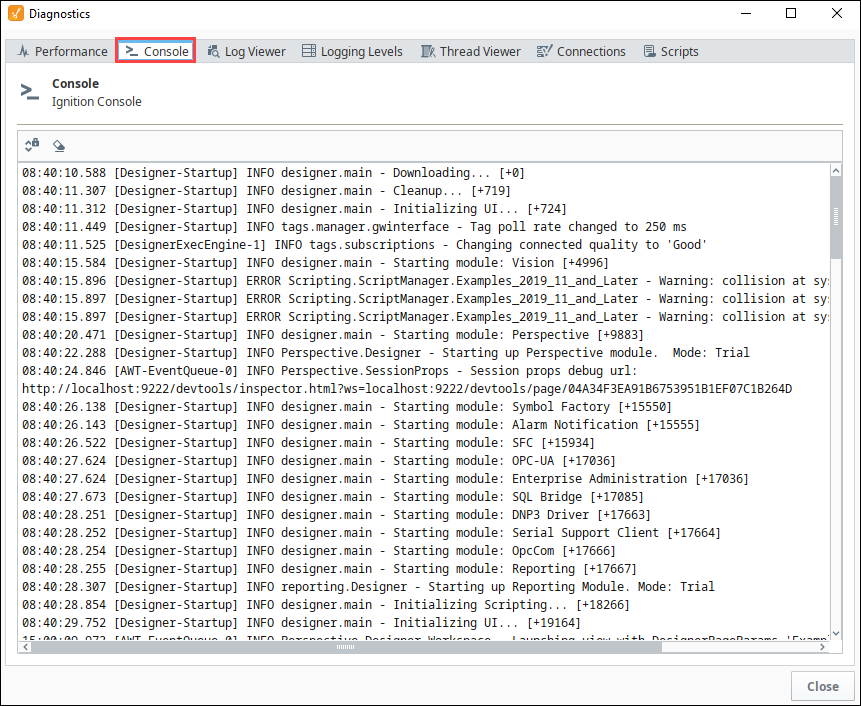
Console Tab
The Console tab displays the Ignition Console. This console displays messages that are generated by the entity that the console was launched from, such as the Designer. Any print statements or errors in your scripts will show up here (except Gateway scope scripts).
Log Viewer
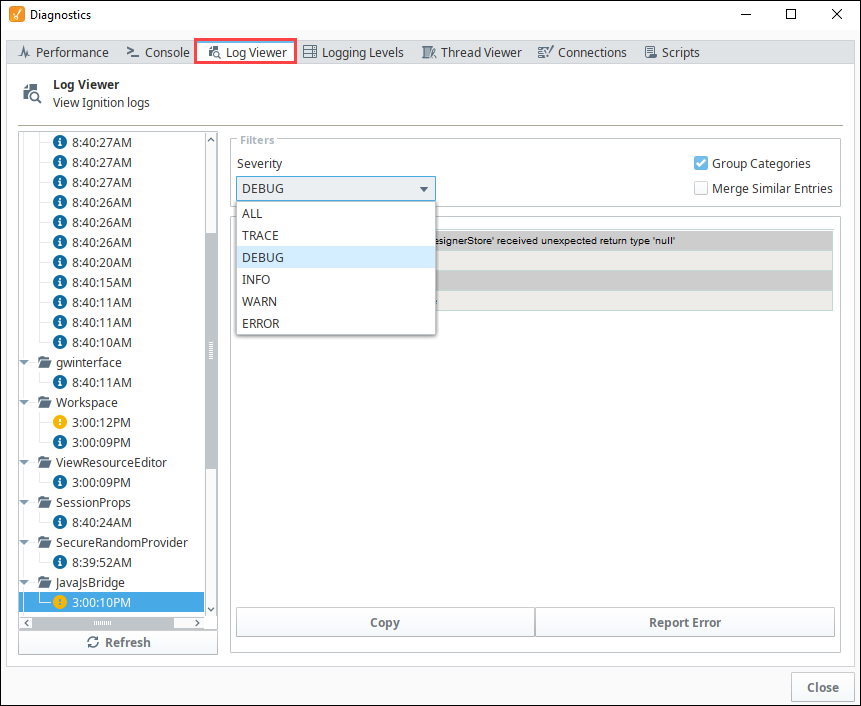
The Log Viewer tab displays the logged events for the current entity, such as the Designer. Whenever messages occur in the console, they are logged and displayed in this tab. Each message has a logging level associated with it. This is a good place to go when troubleshooting an issue, as any errors shown here may illuminate the cause of the problem.
Logs can be filtered by severity by selecting an option in the Filters dropdown. To view entries across all categories chronologically, uncheck the Group Categories checkbox.
Logging Levels
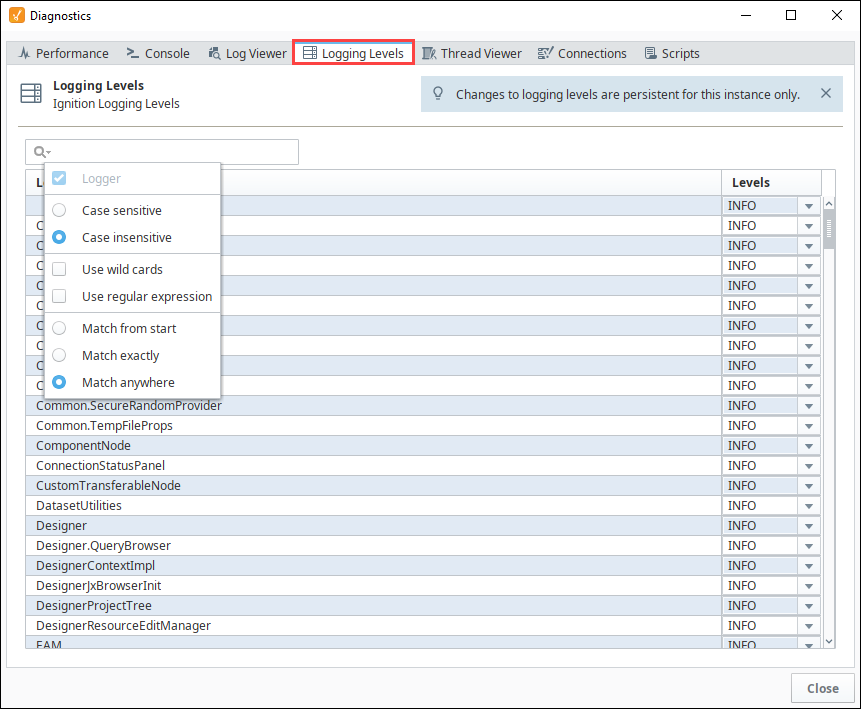
The Logging Levels tab displays the list of internal loggers. Most users will not use this tab unless prompted by a technical support representative. Make sure to change logging levels back to info when you are done, otherwise they will flood your console and make it difficult to find any new problems.
A Search box in the upper left enables you to search the loggers. You can also set options to make the search case sensitive, use wildcards, use regular expressions, match from start, match exactly, or match anywhere.
Thread Viewer
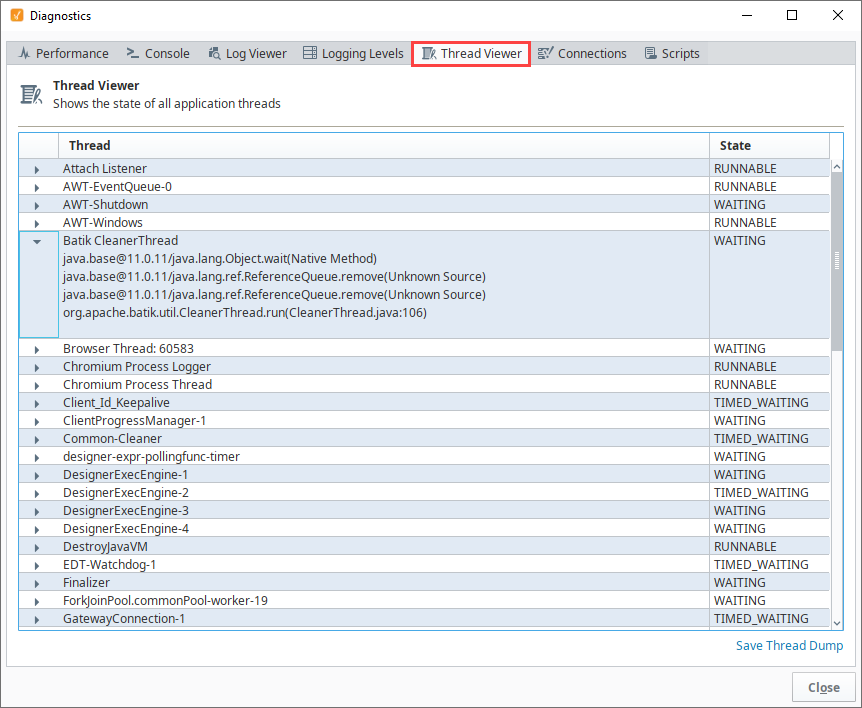
The Thread Viewer tab displays information about the currently running threads. Each thread can be expanded by clicking the Expand ![]() icon or collapsed by clicking the Collapse
icon or collapsed by clicking the Collapse ![]() icon. Most users will not use this tab unless prompted by a technical support representative.
icon. Most users will not use this tab unless prompted by a technical support representative.
Connections
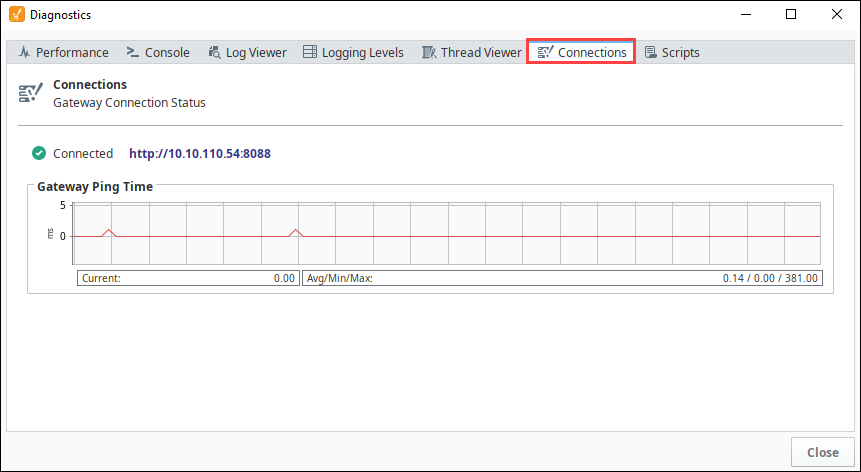
The Connections tab displays the Gateway connection status as well as a realtime chart of the Gateway ping time and a summary with the current ping time and average, minimum, and maximum ping times.
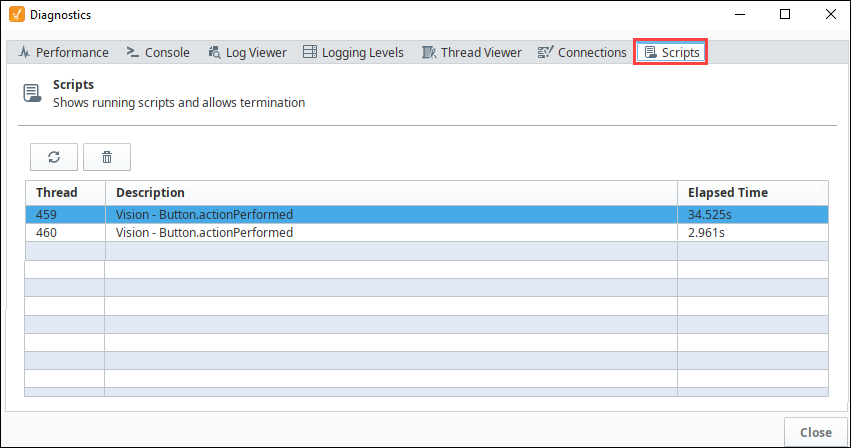
Scripts
Shows running scripts. Use the Delete ![]() icon to terminate a script.
icon to terminate a script.