OPC UA Drivers
A few Ignition drivers are included on install in the form of modules that allow you to connect to specific types of devices over OPC UA. Each module provides the ability to connect to different types of devices.
Device Diagnostics Tags
All drivers include built-in diagnostic tags that can be used to monitor the health of the device connection.
Root Diagnostic Tags
| Tag | Description |
|---|---|
| Connected | A Boolean representing the connection between the device and the OPC UA server. Replaced the legacy "isConnected" tag, which was functionally the same. |
| Hostname | The hostname of the device, as configured in the device configuration on the Gateway. |
| Name | The name of the device, as configured in the device configuration on the Gateway. |
| Port | Represents the port used to communicate with the device. |
| State | A string representing the state of the device configuration. Example: "Connected", "Disconnected". |
| Status | A string representing the status of the device configuration. Generally provides more granular information than the State tag. |
| Internal Indicator (IIN) | New in 8.3.4 Indicates additional diagnositic information specific to the DNP3 and DNP3 (Legacy) drivers. See the Internal Indicators table for more information. |
Sampling Tags
The Sampling folder contains metrics of the device connection's throughput. Each device contains an Aggregate folder, which represents overall performance of the device connection. The Aggregate folder is always present when browsing device connections that make use of one of Ignition's drivers.
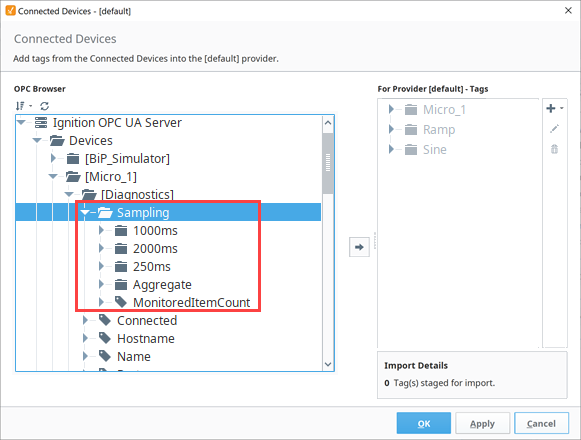
Additional Sampling Group Folders are provided based on active subscriptions, and are grouped by sample rate. These folders contain tags that represent throughput of subscription items at set rates. For example, in the image of the Connected Devices window below we see several folders next to Aggregate: 250ms, 1000ms, and 2000ms. These folders exist because items in the device are being subscribed to at the rates specified.
This means there is at least one item in Micro_1 that is being subscribed to at a rate of 250ms. Thus, the driver has metrics for items that are being subscribed at that rate. Because there is a 1000ms folder, we know there is at least one item being subscribed at a 1000ms rate, and so on. Thus, every additional sampling folder signifies a different sampling group, and exists because something is being subscribed to at that rate.
Subscriptions are most commonly created by Tag Groups, but can be created by other means. For example, Transaction Groups that utilize OPC Items.
Each device contains a MonitoredItemCount tag, which represents the total number of items subscribed to on the Gateway. Note that this count includes device diagnostic tags.
Requests
When Ignition's drivers attempt to read values from a device, it does so with a grouping process. Updates for individual items are grouped into requests. A request is a grouping of tags/items that need to be read at the same time. The number of items in a single request differs per driver, based mostly off of the protocol being used. Some drivers may have additional configurations options that impact how requests are grouped. Since requests have a fixed number of items to monitor, it's fairly common that there are more pending reads than can fit into a single request. As a result, multiple requests are often used to read values from the same device for the same sampling rate.
All requests are placed into a request queue and wait to execute. The Sampling Group Diagnostic tags represent how well the device is able to respond to requests.
Sample Group Diagnostic Tags
The table below describes the various diagnostic tags under the Aggregate and Sampling Group folders. Note that the structure for each type of folder is the same, save for several tags that are not available under the Aggregate folder; those exceptions are noted in the description column.
Tags in the Aggregates folder summarize all requests across all groups, whereas tags in sampling group folders represent metrics for that sample group. All metrics are based off the start of their group, unless specified otherwise. In the case of Aggregates, they're based off the last initialization of the device connection configuration on the host Ignition Gateway.
| Tag | Description | Available in Aggregate Folder |
|---|---|---|
| ActualSamplingInterval | Represents the actual interval the sample group was able to last execute at, in milliseconds. | No |
| ActualThroughput | A count representing the actual number of requests that were able to execute during the last sample interval. | Yes |
| IdealSamplingInterval | The ideal sample interval for the sample group in milliseconds. Generally, this will simply be the configured sample interval. | No |
| IdealThroughput | A count representing the ideal number of requests handled over a 1000ms period. Calculated with the following equation: RequestCount * 1000 / SamplingInterval | Yes |
| OverloadFactor | Represents how well the device is able to keep up with requests at the sample rate. Overload is calculated with the formula: 100 * (QueueDuration / ActualSamplingInterval) If overload exceeds 100%, then requests are being sampled at a slower than ideal rate. | No |
| QueueDuration | Represents the average amount of time a request has spent in the request queue. | No |
| RequestCount | The number of requests within the sampling group. | Yes |
Execution Timer Tags
The tags in the table below represent how long the request process takes. Execution times are recorded in the following manner:
- A timer starts
- The request is sent off to the device
- A response from the device is received by the OPC server
- The timer stops
All of the following tags are available in both sample group folders, as well as the Aggregates folder. Like the sample group diagnostics all metrics are based off the start of their group, unless specified otherwise. In the case of Aggregates, they're based off the last initialization of the device configuration.
| Tag | Description |
|---|---|
| NthPercentile | N% of requests were able to execute at a number of milliseconds equal to or faster than the value on the tag. Example: If 75thPercentile shows a value of 50, then 75% of all requests were able to complete within 50 or fewer milliseconds. |
| Count | Represents the number of requests processed since the start of the sample group. |
| Max | The longest duration an execution took in the sampling group since the start of sampling. Reported in milliseconds. |
| Mean | The average duration for all executions in the sampling group since the start of sampling. Reported in milliseconds. |
| Min | The smallest duration an execution took to complete since the start of sampling. Reported in milliseconds. |
| MeanRate | An average of throughput, since the start of the sampling group. The MeanRate tag in the Aggregates folder represents an average since the last startup of the device connection. |
| OneMinuteRate | A rolling average of throughput over the last minute. |
| FiveMinuteRate | A rolling average of throughput over the last five minutes. |