SFC Elements
SFC Elements are the driving force of a chart. Each element has a purpose or dedicated functionality, and can be combined with other elements to perform complex tasks.. In this section you will see the basic elements that make up every chart. For more information about putting them together, see SFCs in Action.
The chart has some configuration that can determine how and when the chart is started up, as well as opportunities to respond to chart lifecycle events with scripting, such as onStart, onStop, onCancel, and onAbort, see Chart Lifecycle for details.
Chart Elements
There are many elements available for charts, similar to Alarm Pipeline Blocks or other Ignition Components. These elements can be combined in various ways to create a flow chart with logic.

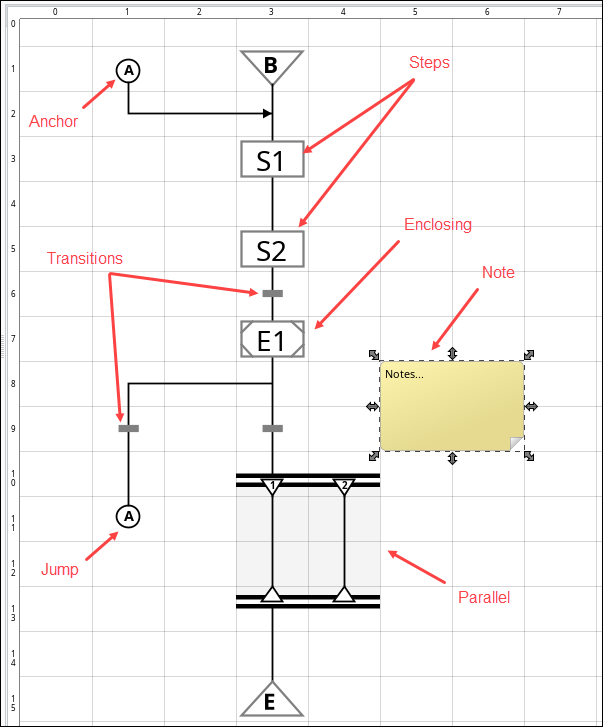
Begin and End Steps
The Begin step is where each chart starts. The End step finishes the logic flow.
Begin Step
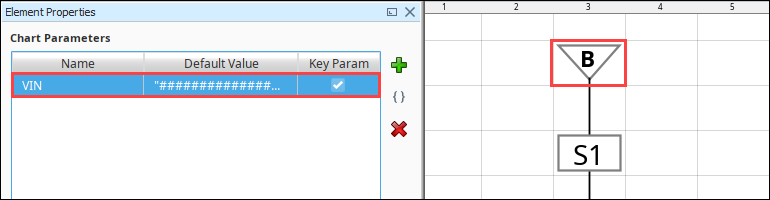
The Begin Step is where all charts start, and cannot be removed, cut, or copied. The begin step is where you can define initial values for your chart's scope. These initial values are also hints as to what parameters your chart expects. If the chart receives any of these parameters as starting parameters, the initial values are ignored.

One of the chart parameters defined on the Begin step can be marked as the Key Param. This means that this parameter is used as an identifier for the chart. For example, suppose your chart defined the automation process for a car through an assembly line. For example, you can define the car's VIN as the key param, which means that instances of this chart are identified by the VIN they were started with.
End Step
The End Step of a chart has no configuration. This is used to mark the termination of the chart. When a chart reaches this step, it stops executing.

There can be many end steps in a chart, although only one is ever reached for a given chart instance. End steps are not allowed inside parallel sections.

Action Step
Action steps do the bulk of the work in an SFC.
The action step can have any number of scripts associated with it. Each of these scripts is called an action. There are various kinds of actions. The different kinds of actions execute at different times in the step’s lifecycle. During the lifecycle of the step, many actions can run, but only one action is ever allowed to run at a time.
The scripts configured in the action step have access to the chart's scope, as well as a special scope that is private to the step. This scope, called "step scope" is initialized when the step starts and destroyed when the step stops, but retained while the step is running. This is a good place for timer actions to store intermediate results.

Action Options
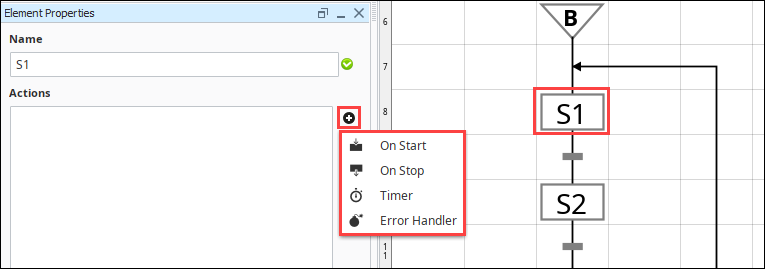
On Start
This action runs when the step is started. These actions always run to completion before flow can move beyond the step, and before any other scripts on the action step will run. This action will always run at least once.
On Stop
When flow is ready to move beyond the step, it is told to stop. The step will then wait for any currently executing action, for example, On Start or Timer actions, to finish. Then it will execute its On Stop action, if configured. Only after these actions complete will the chart be allowed to move on. This action will always run at least once.
Timer
Timer actions run every so often while the action step is running. The timer actions only start running after the On Start action finishes (if there is one). In addition to the timer action's script, it must have a rate, specified in milliseconds. This is the amount of time to wait between running the timer action's script. The clock starts after the On Start action finishes.
It is important to realize that, unlike On Start and On Stop scripts, a timer action can not run at all for an action step. If the step is ready to stop before the timer is ready, it will never run.
Error Handler
This action will run only if any of the other actions throw an unexpected error. This provides a chance for chart designers to do their own error handling, and gracefully recover from an error. If this script throws an error, the chart will abort, see Chart Concepts for more information.
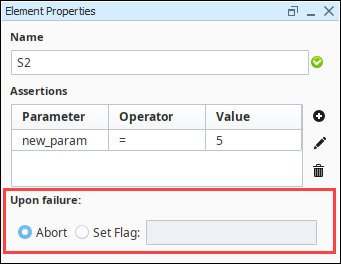
Assertion Step
Check some conditions before moving on.
The Assertion Step makes one or more conditional assertions and will abort the chart or set a flag based on the result. Each assertion looks at a chart parameter and checks its value. If the value meets the condition, then the assertion passes, and the chart moves on.

Multiple assertions can be added to each Assertion Step, with each requiring a parameter name, an operator, and a value.
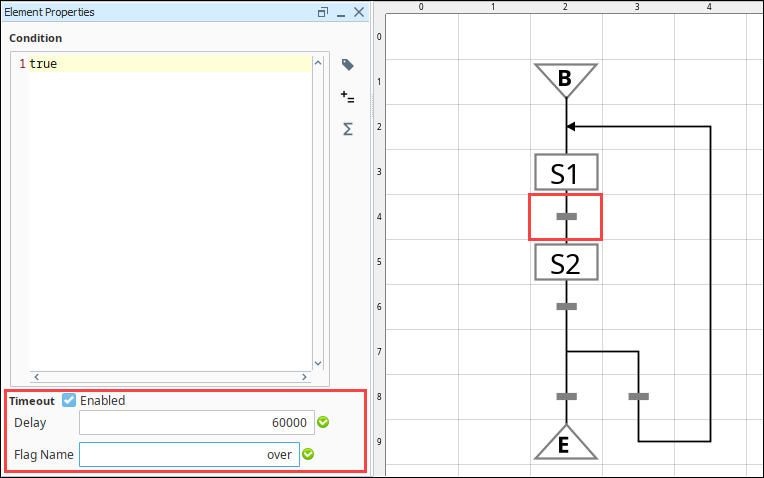
Transition
Transition elements control the flow of the chart.
A transition serves to either block or allow flow, depending on its value. All transitions have a value: true or false, which is determined by an expression. Transitions occupy a one-cell region of the chart, and are represented by a short horizontal bar in the middle of the cell. Read more about how transitions control chart flow on the Chart Flow and Rules page.

In addition to their expression, a transition can also specify a timeout. If enabled, the transition will set a flag after a certain amount of time has passed. This flag is a boolean variable set in chart scope, and can be used to make the expression or another expression close.
Parallel Element
A Parallel element contains other elements and executes the logic in parallel. This element is ideal in cases where multiple actions need to execute simultaneously, and you want the chart to pause until all of those actions have completed.
A parallel section is a rectangular section of the chart that can contain other chart elements inside it. The top and bottom of the parallel section is demarcated by two thick, parallel lines. Parallel sections allow for concurrent execution of multiple steps.

The top lines are called the "parallel branch" and the bottom are the "parallel sync". These sections are used to execute multiple branches of the chart at the same time.
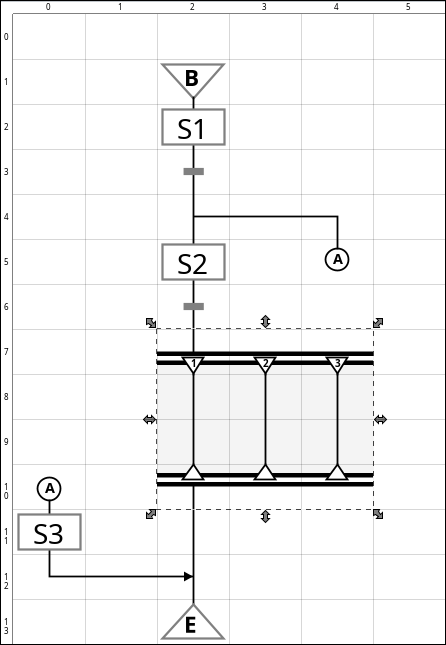
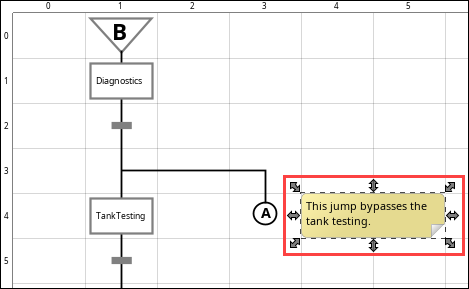
Jump and Anchor
A Jump element moves the logic of a chart from the jump to a matching anchor element.
A jump is an element that moves the flow to its matching anchor. This is a convenience for when a link would be unsightly or impossible due to crossing other links. Each jump and anchor element is identified by a single character; jumps identified by X will jump to the anchor also identified by X. There can be many jumps on a chart that all jump to the same anchor.

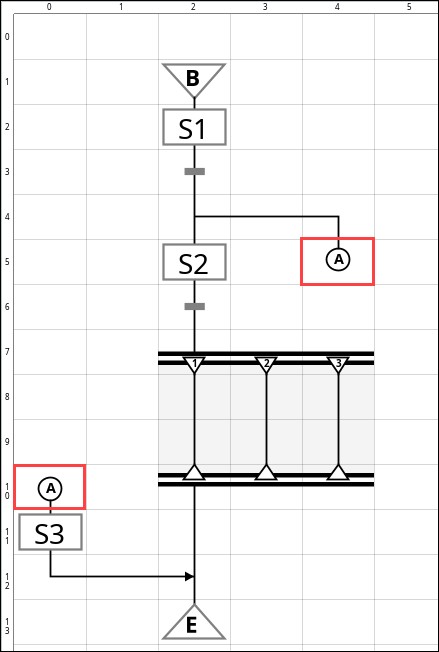
Since Jumps and Anchors have separate name spaces in Parallel sections, you cannot Jump from a Parallel section to the normal chart, nor from the normal chart into a Parallel section. Attempting to do so will result in a no matching anchor error.

Enclosing Step
Run another chart inside this one, allowing complex tasks to be spread across several different charts.
The Enclosing Step references another SFC defined on the same Gateway. This is an important tool for SFC design, because it lets the chart designer create reusable blocks of logic encapsulated into charts, which can make chart design more modular.

When talking about enclosing steps, the chart that the enclosing step references is called its enclosed chart, or subchart. The chart that the enclosing step is in is called the parent chart.
# A '.' is used to reference a hierarchy object in the same folder
./myChart

# '..' is used to reference the parent folder of the current object
../myChart
In addition, the Enclosed Chart dropdown will now automatically use relative path notation.
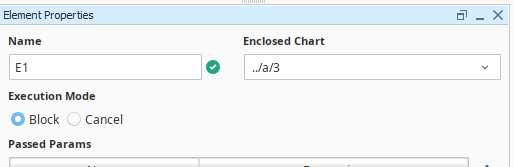
When flow reaches an enclosing step, it starts its enclosed chart. Using the enclosing step's Execution Mode property, the step can be configured to work in one of two very different ways:
- Execution Mode = Block Let the enclosed chart run to completion. This means that the enclosed chart should have an End Step in it, and that flow will not be able to move beyond the enclosing step until the enclosed chart stops by reaching its end step.
- Execution Mode = Cancel Cancel the subchart when the enclosing step is ready to stop. This means that the subchart is canceled when flow is ready to move beyond the enclosing step. Any running steps in the enclosed chart are told to stop, and flow ceases in the enclosed chart.
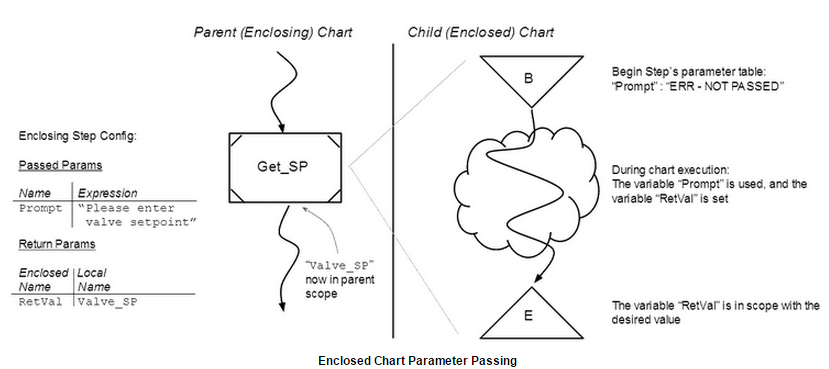
Parameter Passing
When invoking a subchart via an enclosing step, you have the opportunity to define how variables are passed and returned between the parent and child chart’s scopes.
The enclosing step can define a list of parameters to be passed into the enclosed chart’s scope. The values for the parameters will be expressions, thus they can be literal values or they can be references to variables in the enclosing chart’s scope.
The enclosing step can also define a list of return values to receive from the enclosed chart. This is a mapping of variable names from the enclosed chart’s scope to variable names in the parent chart’s scope.
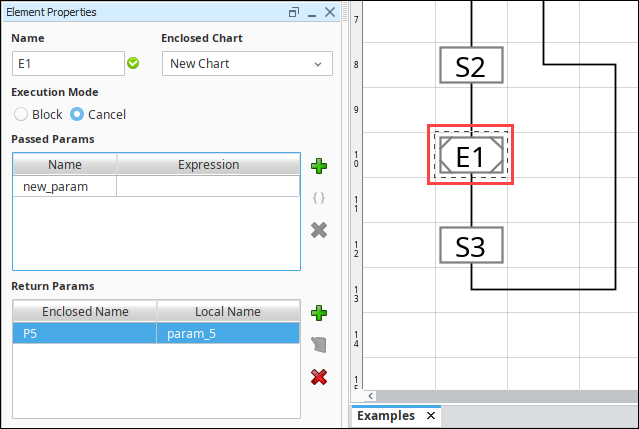
Return values can now be mapped to Chart Scoped Variables by using the same syntax that they would in the passed parameters. See Chart Scope and Variables.
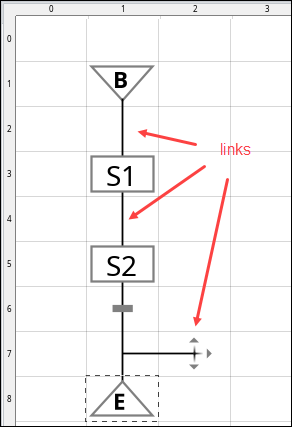
Links
A link is simply a line that connects other elements. Links are created in the Designer by dragging the arrows that appear next to unconnected elements. Links cannot cross above or below other elements or links. Links only travel in a single direction. This direction is determined by what the link is connecting to. Most elements such as steps and transitions only accept incoming links from above and outgoing links from below.
Notes
Notes are elements which have no import or function, but serve as documentation.

Note elements can be placed anywhere except that they can not overlap other elements. Notes are used to annotate chart logic but have no effect on the chart itself.