SFC Basics
Architecture
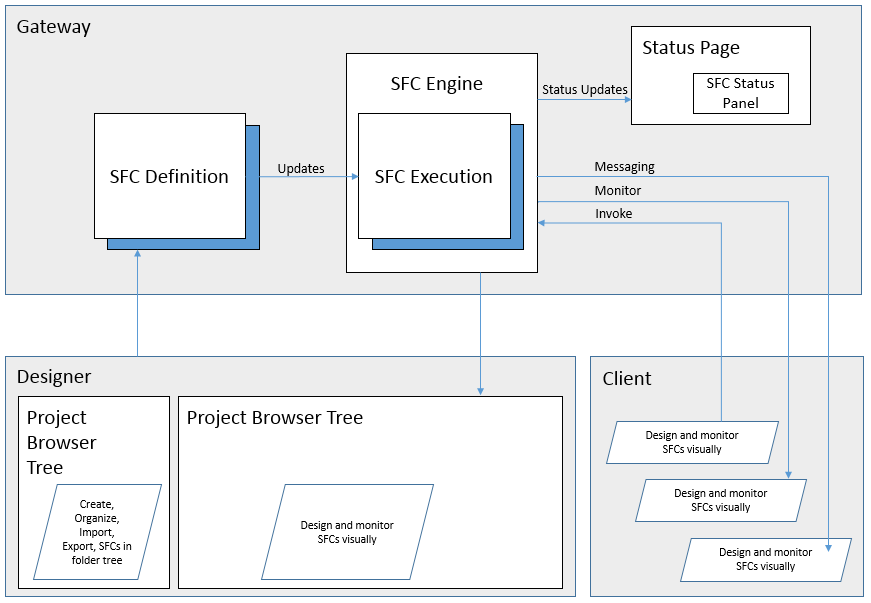
Sequential Function Charts (SFC) are designed through drag-and-drop manipulation in the Designer. The charts are located in a folder in the Designer's Project Browser. Charts are not part of any specific project; they are shared by all projects.
SFCs are executed in the Gateway. While any scope (Client, Designer, or Gateway) can start a new chart instance, the chart instance always executes in the Gateway.
SFC instances can be monitored in either the Client or the Designer. To monitor a running chart instance in the Designer, you can open that chart in the SFC workspace and double-click on the running instance. To monitor a running chart in the Client, a Vision project must be designed that uses the SFC module's monitoring panel component.
SFC Execution in Gateway
Run Modes
Each sequential function chart can be configured to use one of the following Execution Modes:
-
Callable: This chart can be started via scripting or another chart's enclosing step on-demand. Any number of instances of this chart can be simultaneously running.
-
RunAlways: This chart can be started by the Gateway upon startup. It can not be executed in any other way. It is probable that this chart be designed to never end, the idea being that there will always be exactly one instance of this chart running.
-
Disabled: This chart is not available for execution.
Steps
Steps are the parts of the chart that do useful work. Steps are represented as a rectangle that occupies a one-cell region of the chart, except for the begin and end steps, which are triangles. Steps might run scripts, or execute other charts depending on how you set them up.
There are four types of steps:
- Begin and End Steps
- Action Step
- Assertion Step
- Enclosing Step
In addition to these, there are multiple SFC elements that allow for more complex logic in your SFC.
Designing Charts
Before a chart is executed, it must have a correct structure. When designing a chart, the Designer will constantly let you know whether or not your chart is valid. If your chart is not valid, you may choose to show the errors. The error shows up as red triangles in the corner of any element which has a problem. Hover your mouse over these elements to discover what is wrong with them.
Here are some rules about structure to keep in mind:
- Everything must be fully connected (except for Notes).
- Flow typically moves from top to bottom. All elements must be entered from the top and exit from the bottom (not the sides).
- There can be any number of end steps. If flow reaches an end step, the chart is stopped. If there are no end steps, it means that your chart must loop back upon itself to satisfy the connected rule.
- End steps are not allowed inside parallel sections.
Chart Instance
Each chart you define in the Designer may be invoked multiple times, and each invocation will start a new instance of that chart. The instances may be started with different starting parameters which affect how the chart works. Each instance runs completely independently of the other instances. The ability to have multiple instances of a chart is one important feature that makes SFCs within Ignition different than SFCs inside of PLCs.
Scripting Reference
For information about the scripting API methods available for sequential function charts, see System Functions.