Charting - Right Click Menu
When viewed from the client (or the Designer's Preview Mode ![]() ) many chart components, such as the Easy Chart or Bar Chart, enable users to right-click and access a menu with additional features. Explanations of these features are listed below.
) many chart components, such as the Easy Chart or Bar Chart, enable users to right-click and access a menu with additional features. Explanations of these features are listed below.
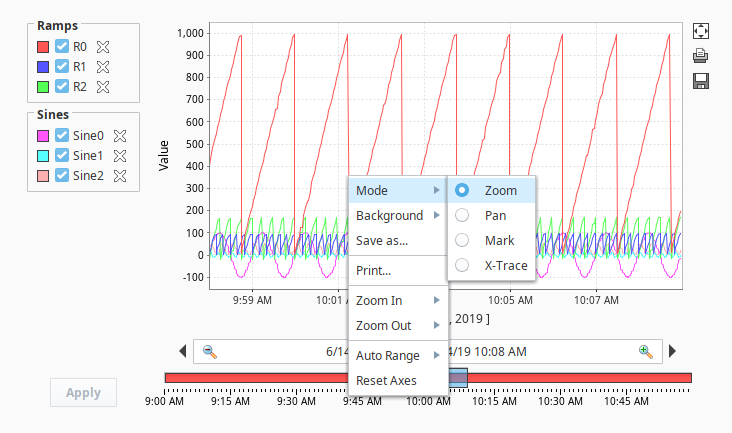
Right Click Menu Functions
Note that many of the behaviors listed below may be overridden by a property on the parent component. For example, the Easy Chart provides a way to define the plot background color with the Easy Chart Customizer, so the Background options on the right-click menu would not modify the behavior on the component when the user selects them.
| Item Name | Description |
|---|---|
| Mode | Specifies the functionality of a left-click on the chart. A list of available modes can be found on the Mode Options section. |
| Background | Allows the user to change the background color. Available options include Black and White. |
| Save as... | Provides a Save window that allows the user to save a PNG of the chart locally. |
| Print... | Provides a Print dialog that allows the user to print an image of the chart. This will send the chart to a physical printer. Note: a printer must be installed on the client computer. |
| Zoom In | Allows the user to Zoom in on the chart. There are three possible options:
|
| Zoom Out | Allows the user to Zoom out on the chart. There are three possible options:
|
| Auto Range | Automatically updates the range, or viewable space, on the chart to incorporate all data points. As mentioned above, many components have properties/customizations that restrict the capability of these (such as the date range on on the Easy Chart).
|
| Reset Axes | Adjusts the Axes back to their initial state. |
Mode Options
Below is a description of the various options under the Mode property.
Zoom
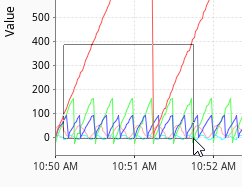
- Zoom in: Users can left-click and drag on the chart to zoom in or out. Dragging to the right creates a hollow rectangle. When the user releases the mouse button, the viewable space in the chart will zoom in to a rectangle.
- Zoom out: Left-click and dragging to the left will not create a rectangle, but releasing the mouse button will zoom back out.
Pan
Allows users to Pan the chart horizontally or vertically by left-click and dragging. The Pan mode may be used after using the Zoom mode: doing so allows panning within the zoomed in view-space.
Mark

While in Mark mode, a left click will target the closest point on the nearest pen, and return the value and timestamp of that point.
X-Trace
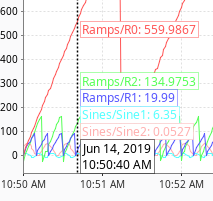
Similar to Mark, X-Trace will instead show the values of all pens at the selected point in time.