Report - Line Shape
The Line shape component can be used to display a straight line any where in a report. It can run north-south, east-west, or diagonally. Select the Line shape on the Report Component Palette to make it active, and click and drag to draw a Line any where in your Report Designer. Hold shift while dragging to force the angle of the line to a 45 or 90 degree angle. You can change the stroke style, color, width, pattern, and more.

Report Design Component Palette Icon
![]()
Properties
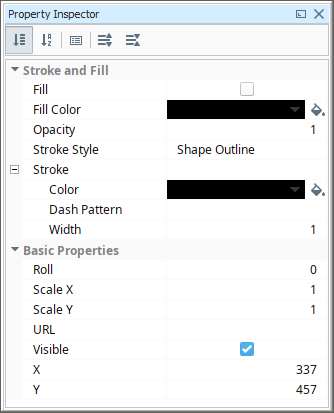
| Property | Description |
|---|---|
| Fill | If true, the shape will fill its space with color. |
| Fill Color | If true is selected, the color that will fill the shape. |
| Opacity | How opaque the fill color is, between 0 and 1. |
| Stroke Style | What style of stroke or border to use: Hidden; Shape Outline; Border; Double. To learn more about stroke styles, refer to Stroke and Fill Properties.
|
| Stroke | Details for the chosen stroke. Each Stroke has its own properties depending on the Stroke Style chosen. |
| Roll | Number of degrees this shape is rotated clockwise. |
| Scale X | Amount to scale the width of this shape. 1 is scale to 100%. |
| Scale Y | Amount to scale the height of this shape. 1 is scale to 100%. |
| URL | New in 8.1.19 A link to attach to this reporting component. Will be a clickable hyperlink if the report is exported as a PDF. You can use the values below to link to internal pages.
|
| Visible | If true, the shape will be visible. |
| X | Horizontal distance in pixels between the left edge of this shape and the left edge of the page. |
| Y | Vertical distance in pixels between the upper edge of this shape and the top edge of the page. |
| Stroke Color | Color of the line. |
| Stroke Width | Width of the stroke in pixels. |
Example
This example demonstrates possible property values that result in two orange lines.

| Property | Value |
|---|---|
| Stroke Style | Border |
| Stroke Color | FF8C00 |
| Border Bottom | True |
| Border Top | True |
| Stroke Width | 5 pixels |