Connections - Devices
Devices
The Devices page lists the currently configured OPC-UA devices, and lets you know which are connected and which have a faulty connection. From here, you can drill into a device connection to see how many Tags Ignition is requesting from the device, along with how often it is requesting them. This information can be used to determine if we are overloading the device with too many requests too quickly, or if we can request more from our device.

Devices Page
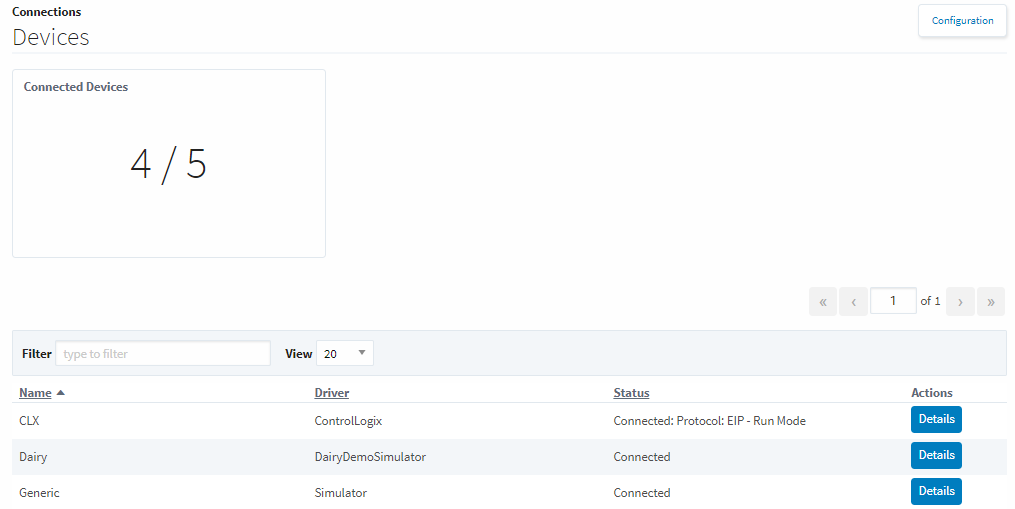
The main Devices page lists out all OPC-UA devices, as well as how many currently have a valid connection.
This will only show the devices connected through an Ignition device connection. For information about devices connected through other OPC Servers, see those programs.
| Attribute | Description |
|---|---|
| Connected Devices | Number of devices connected out of configured devices. |
| Name | Name of the device. |
| Driver | Name of the device driver. |
| Status | Current device status. |
Device Details
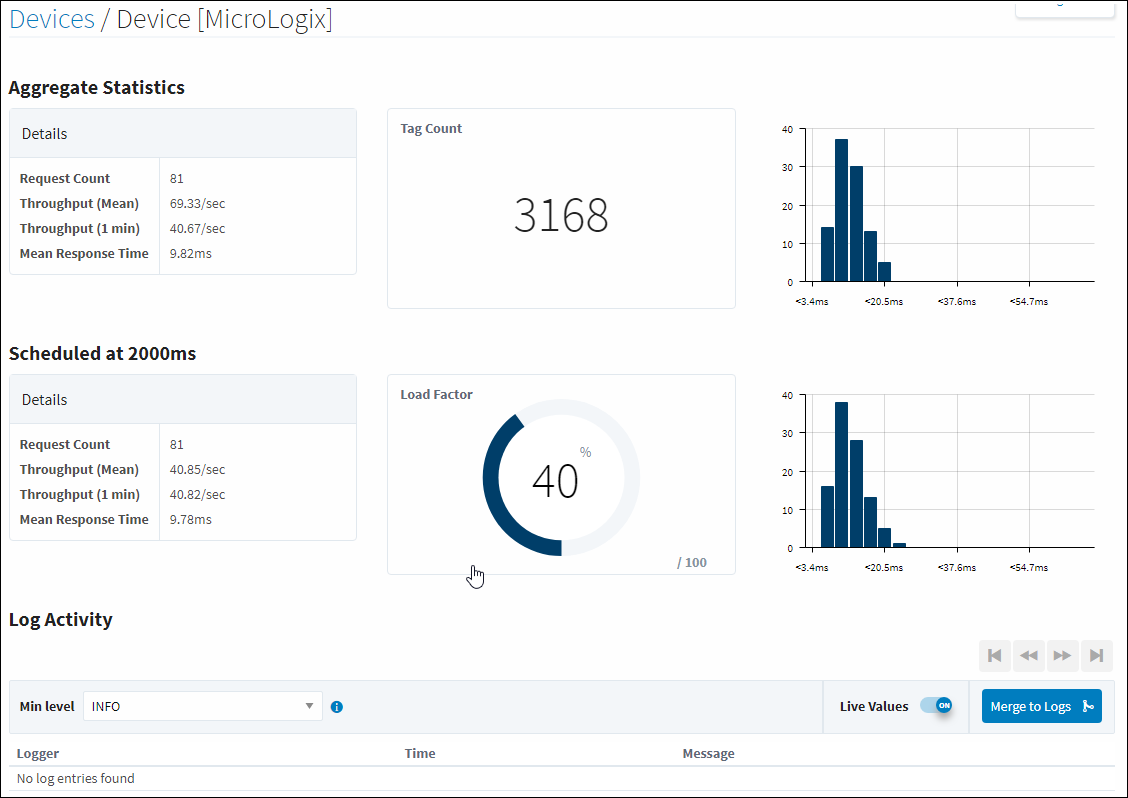
Clicking the Details button to the right will display a diagnostics page for that device which provides a lot of useful metrics like a Tag count. The log at the bottom of the page will display recent events that pertain to that particular device.
The Device Details page also lists statistics to help determine if the device is overloaded with requests. There are values for each scan class that are configured on Tags from the specified device, as well as aggregate statistics which pull from all scan classes to get an average for the device. The four values are listed in the table below.
Aggregate Statistics
| Attribute | Description |
|---|---|
| Request Count | Tracks the number of requests that are coming in from the device, each request consisting of multiple Tags. How many Tags are in a request can vary between devices, which Tags are being requested, and how often they are requested. |
| Throughput (Mean) | Average amount of requests that come through per second since the device was last started. If the device connection is edited and saved, this will cause the device connection to reinitialize and this value will be reset. |
| Throughput (1 min) | Average amount of requests that come through per second for the last minute. |
| Mean Response Time | Average time it takes for Ignition to get a response from the device. This number should be an average of the graph on the right of the page. |
So based on the statistics above, we can determine if we are overloading our device by requesting too many Tags too quickly. We simply need to take the throughput and use that to determine how many total requests come in per scan class execution. If this is at or above the request count, then our device can keep up with the numbers we are requesting. If it is below the request count, then the number of requests we are making to the device aren't coming in as fast as we want them, which can lead to poor device performance or bad values.
For example, take the image below. Scheduled at 2000ms, we have 81 requests. Our average throughput is about 40.8 requests a second. This means that every two seconds, we get 81.6 requests. Since we are making 81 requests every two seconds, this is exactly what we would expect to be getting from this device.
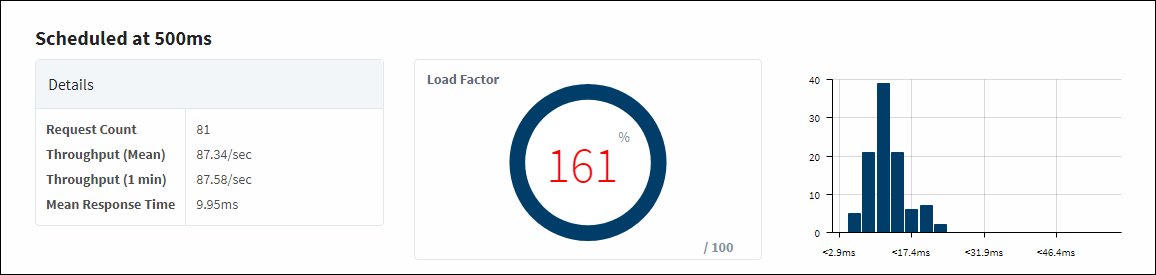
However, if we altered the scan class on the same device to 500ms, we see a very different picture. The request count is still 81, but because we are requesting values every 500ms, we should see about 162 requests coming through every second. The throughput values only show us getting about 87.5 requests per second, which is about half of what we actually are asking for. This would indicate that our device is overloaded, which can also be seen in the Load Factor. Our Tags would not be updating as quickly as we would like, which could lead to bad Tag values.