Using Audit Profiles
Audit Profiles cause Ignition to record details about specific events that occurred. Audit Profiles are simple to set-up, and immediately start to record events. By default, only Tag writes, SQL UPDATE, SQL INSERT, and SQL DELETE statements are recorded. This allows you to keep track of which user wrote to which Tag, or modified which table. Furthermore, a time-stamp is recorded, so you can easily track the changes and outline an order of events.
Audit Profile Types
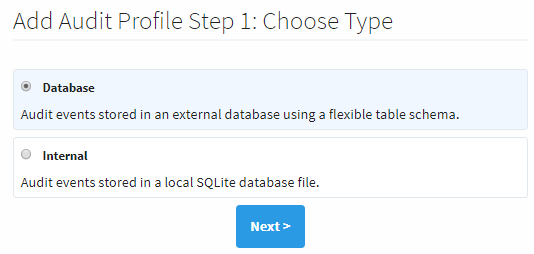
There are two different types of audit profiles: Database and Internal. Database type stores audit events in an external database. Internal type stores audit events in a local SQLite database file.
To Create an Audit Profile for a Database Profile Type
-
Go to the Configure section of the Gateway.
-
Choose Security > Auditing from the menu on the left.
-
The Audit Profiles page is displayed, and click Create new Audit Profile link.
-
Select Database or Internal audit profile type. This example uses the Database type, then click Next.

-
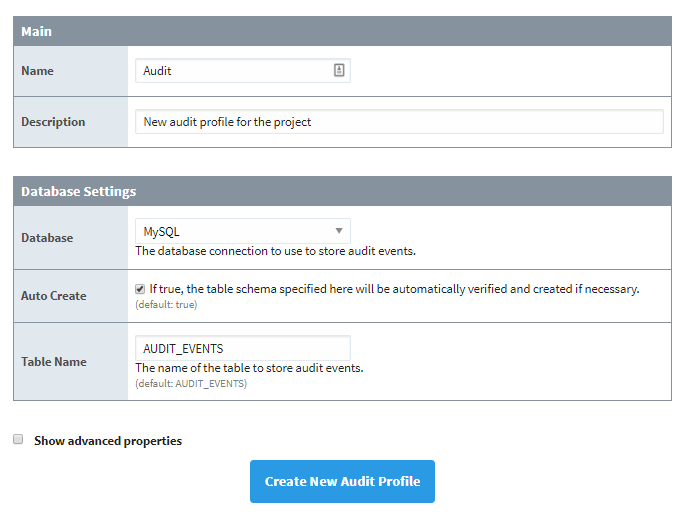
Enter the Name of the audit log and Description (optional).
-
Under the Database Settings, select the Database where the table will be stored, select the Auto Create check box, and enter the desired Table Name.
-
Click Create New Audit Profile.

Once some changes have been made to a Tag or a Database table, Ignition will begin recording.

Auditing Project Events
A project can be assigned to an Audit Profile. Once configured, Ignition will track changes made to the Designer, as well as keep track of when users logged in or logged out of a client. Additionally, the hostname of the computer used will be recorded.
To Assign an Audit Profile to a Project
-
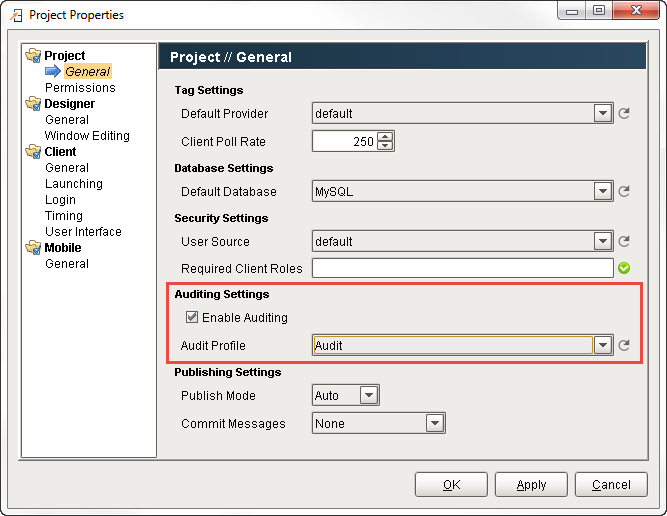
Go to the Designer, open the project that you want to enable auditing on, and go to Project > Properties.
-
Go to the General section, select the Enable Auditing check box, and select your Audit Profile from the drop-down menu. The audit profile is used to record audit actions for your project. If the new audit profile does not show up, click Refresh.
-
Click OK.
-
Save your Project.

To View Information in an Audit Log
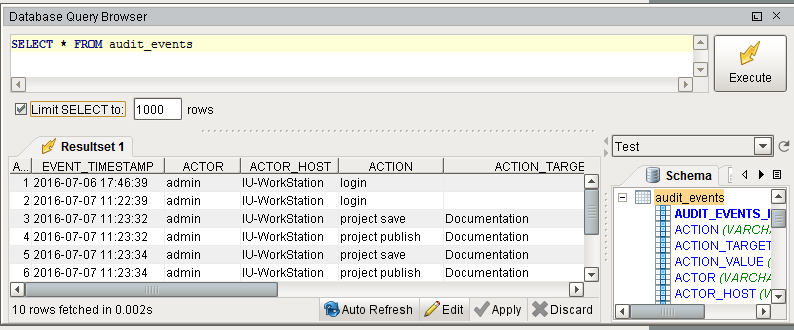
There are a few ways to view audit information: using a Table component, interface on the Gateway, or the Database Query Browser. Here is one example of viewing an Audit Log using the Database Query Browser.
-
Go to Tools > Database Query Browser.
-
Under the Schema area, double click on a table, and it will expand the query in the Database Query Browser area.
-
Click Execute, and all the audit log data will be displayed in the Resultset1 area.

Refer to the Database Query Browser to learn more about how it works.
Audit Table Definition
The following table describes the audit table as it exist in the database:
| Column Name | Description |
|---|---|
| AUDIT_EVENTS_ID | The id of the row. |
| ACTION | Brief description of the action. |
| ACTION_TARGET | The target of the action. |
| ACTION_VALUE | The value acted upon the action target. |
| ACTOR | The logged in user when the action occurred or a description of the system that generated the action. |
| ACTOR_HOST | The host computer where the action occurred. |
| EVENT_TIMESTAMP | The time when the action occurred. |
| ORIGINATING_CONTEXT | A numerical description of the origin of the originating system. gateway = 1, designer = 2, client = 4 |
| ORIGINATING_SYSTEM | The name of the project or system where this action occurred. |
| STATUS_CODE | A 32 bit integer that represents a bitmask of severity (good, bad, uncertain). The bitmask represents the status of the action recorded. For example, a tag write failing would result in a "bad". |
ORIGINATING_CONTEXT
| Scope | Value |
|---|---|
| Gateway | 1 |
| Designer | 2 |
| Client | 4 |
Custom Auditing
The Audit Table is simply a database table, so custom events can be logged to the table. This is commonly done through scripting events. In most cases, users will log certain button presses and event values by adding just several lines of code.
