Perspective - Radar
Component Palette Icon:

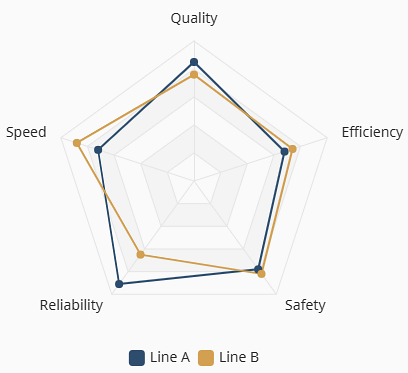
The Radar component compares multiple values across several dimensions simultaneously, making this chart ideal for multi-dimensional performance analysis. Each dimension creates an additional spoke on the chart and represents a specific metric to compare values.
Properties
| Name | Description | Property Type |
|---|---|---|
| data | Dataset powering the chart. Each row represents one radar dimension. Row value fields are then referenced in axes.nameField value for the dimension title, axes.maxField value for the dimension max limit, and each series.valueField value for the dimension values to plot. | array |
| axes | Radar dimension definitions that control how the spokes are labeled and scaled.
| object |
| series | Defines the fields to plot and how the polygon will render for each series.
| object |
| legend | The legend display configuration.
| object |
| title | Chart title and subtitle.
| object |
| appearance | Configures the chart theme and layout.
| object |
| style | Style configuration for the chart. Full menu of style options is available. You can also specify a style class. | object |
tooltip Properties
| Name | Description | Property Type |
|---|---|---|
| visible | Shows the tooltip when true. | boolean |
| format | Sets the tooltip display format. Configurations set here will apply to all pens. Options include:
| object |
tooltip Formatting Options
Tooltip display can be customized with the following built-in formatting properties and token options. Tokens serve as placeholders that will be replaced with live data during runtime. They are case-sensitve, include no spaces, and must be enclosed with curly braces. Index suffixes are accepted when entered as the series number following a colon.
All tooltips will render using the en-US locale unless otherwise specified. When translated, text is processed as a whole phrase. Additionally, tooltips are HTML, so basic markup works within templates. However, the tooltip value expression is not HTML so <b>{value}</b> shows the value literally. The table below describes the available tokens that can be used, as well as some possible format examples.
| Token | Description | Example Format | Example Output |
|---|---|---|---|
{value} | The y-axis value. When value is selected as the format.type, default dropdown options include %, kW, and °F. However, any unit can be entered before or after {value} by typing directly into the field for either type selection. | |  |
{marker} | Displays the series[].color selection as an identifying marker dot. Available for template types only. | |  |
{series} | Displays the series[].label text. Available under template types only. | |  |
{category} | Displays the x-axis value. Available under template types only. | |  |
{sum} | Displays the total y-axis value for all series data sharing an x-axis category. Available under template types for stacked and diverging variants only. | |   |
Component Scripts and Events
Further component interaction and functionality can be configured for all components through scripting and event actions. Right-click on the component or select Components from the Designer menubar to access the configuration popups for both of these options:
- Configure Events: Accesses the Event Configuration popup where you can configure actions to run in response to events to make the component dynamic. The Events Configurations page shows how to configure events and actions on a Perspective component.
- Configure Scripts: Accesses the Script Configuration popup where custom methods and message handlers can be added. The Scripting in Perspective section details scripting fundamentals, creating custom methods, and using message handlers.
The Radar component also has Component Events associated with it. See the Perspective - Radar Scripting page for more information.
Example
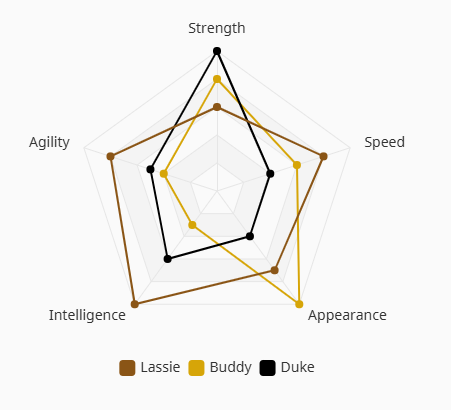
The example chart uses the following data values for Lassie, Buddy, and Duke. These values are then referenced in the series configuration to assign the given values and titles.
data.0
dimension: Strengthmax: 10lassie: 6buddy: 8duke: 10
data.1
dimension: Agilitymax: 10lassie: 8buddy: 4duke: 5
data.2
dimension: Intelligencemax: 10lassie: 10buddy: 3duke: 6
data.3
dimension: Appearancemax: 10lassie: 7buddy: 10duke: 4
data.4
dimension: Speedmax: 10lassie: 8buddy: 6duke: 4
| Property | Value |
|---|---|
| axes.nameField | dimension |
| axes.maxField | max |
| series.0.label | Lassie |
| series.0.valueField | lassie |
| series.0.color | #8A5516 |
| series.1.label | Buddy |
| series.1.valueField | buddy |
| series.1.color | #D6A508 |
| series.2.label | Duke |
| series.2.valueField | duke |
| series.2.color | #000000 |