Perspective - Pie Chart
Component Palette Icon:

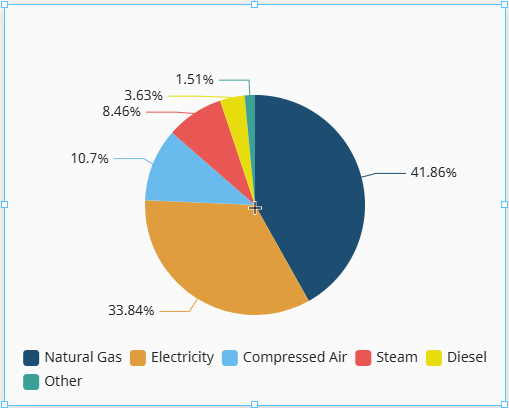
The Pie Chart component displays a list of named items, each of which has a value that is part of a total. The total is the sum of the value of each item. The key to the Pie Chart component is the data property, which contains the items that will be displayed as pie wedges. It is fully customizable in its appearance, from colors, line widths, text styles, and more.
The Pie Chart component has three pre-configured variants:
- Basic: Default layout described above.
- Donut: Layout with a center hole for KPI labels.
- Rose: Layout featuring equal-angle slices, with radii proportional to value.
Properties
| Name | Description | Property Type |
|---|---|---|
| data | Data source for the chart. Each object within an array defines the name and value for a single pie section. See data properties for more. | array |
| labels | Controls the text labels displayed on or near each slice. See labels properties for more. | object |
| centerLabel | Controls the label displayed in the center of a Donut chart.
| object |
| legend | Chart legend configuration. See legend properties for more. | object |
| title | Chart title and subtitle configuration and styling. See title properties. | object |
| tooltip | Tooltip text shown on hover.
| object |
| appearance | Controls the chart visual theme, sizing, animation, and background. See appearance properties for more. | object |
| style | Use styles to customize the visual style of the component. Full menu of style options is available for text, background, margin and padding, border, shape and miscellaneous. You can also specify a style class. | object |
data Properties
The data object contains a flat array of individual slice objects. Each entry is a named category with a value. The component calculates proportions automatically, so there is no need to pre-compute percentages.
| Name | Description | Property Type |
|---|---|---|
| name | Name of the slice. This value is also displayed in the legend, tooltip, and slice labels. Referenced by the onClick event as event.name. | string |
| value | Numeric value for the slice. Propertions are calculated automatically from the sum of all values. | number |
| color | Color of the slice. Overrides appearance.colorPalette auto-assignment for this slice. Can be chosen from the color wheel, color palette, or entered as RGB or HSL value. See Color Selector. [optional] | color |
labels Properties
The labels object supports rich label positioning, such as outside the slice, inside the slice, or as a callout line to the side of the slice.
| Name | Description | Property Type |
|---|---|---|
| visible | Whether to show labels for each slice of this chart. Default is true (show). | boolean |
| position | Label placement relative to the slice. Default is outside.
| string |
| content | What each label displays. Default is percent.
| string |
| format | Custom format expression. Overrides the content property when not empty. Exposes {name}, {value}, and {percent} tokens. | string |
| fontSize | Font size of slice labels in pixels. | number |
| color | Label text color. Defaults to the slice color when the position property is set to outside, and white when set to inside. Can be chosen from the color wheel, color palette, or entered as RGB or HSL value. See Color Selector. | color |
| lineVisible | Whether to show the callout line connecting the slice to its outside label. Default is true (show). Only relevant when the position property is set to outside. | boolean |
| elementStyle | Sets a style for this element. Full menu of style options is available for text, background, margin and padding, border, shape and miscellaneous. You can also specify a style class. | object |
legend Properties
| Name | Description | Property Type |
|---|---|---|
| visible | Whether to show the chart legend. Default is true (show). | boolean |
| position | Where the legend is anchored relative to the chart. Can be top, bottom, left, right. | string |
| orientation | Direction the items in the legend flow in. Can be horizontal or vertical. | string |
| interactive | If true, clicking a legend item toggles that slice's visibility. Default is true. | boolean |
| fontSize | Font size of legend item labels in pixels. | number |
| elementStyle | Sets a style for this element. Full menu of style options is available for text, background, margin and padding, border, shape and miscellaneous. You can also specify a style class. | object |
title Properties
| Name | Description | Property Type |
|---|---|---|
| visible | Whether to show or hide the chart title. Default is true (show). | boolean |
| text | Chart title text. | string |
| color | Chart title text color. Takes precedence over elementStyle.color when both are set. Can be chosen from the color wheel, color palette, or entered as RGB or HSL value. See Color Selector. | color |
| fontSize | Font size of the chart title text. Takes precedence over elementStyle.fontSize when both are set. | number |
| subtitle | Subtitle text displayed below the main chart title.
| object |
| position | Position of the title within the chart. | string |
| gap | Gap between the chart title and subtitle in pixels. | number |
| elementStyle | Sets a style for this element. Full menu of style options is available for text, background, margin and padding, border, shape and miscellaneous. You can also specify a style class. | object |
appearance Properties
| Name | Description | Property Type |
|---|---|---|
| colorPalette | Colors for each slice in the chart, arranged in the array order configured in the data property. Defaults to the Ignition theme palette for slices that do not have an explicit data.color. | array |
| innerRadius | Inner radius of the chart as a percentage of the outer radius, or absolute pixels. 0 renders a Pie, while any value greater than 0 renders a Donut. | number |
| outerRadius | Outer radius of the slices as a percentage of the component container, or absolute pixels. | number |
| centerX | Horizontal center position of the chart, as a percentage of the component container. | string |
| centerY | Vertical center position of the chart, as a percentage of the component container. | string |
| borderRadius | Corner radius of each slice in pixels. A smaller value (e.g. 4) gives slices a rounded appearance. | number |
| borderWidth | Width of the border between slices in pixels. | number |
| borderColor | Color of the border between slices. | color |
| roseType | If true, enables Rose variant mode. Slices will have equal angles, but varying radii proportional to the slice value. Default is false for Pie and Donut, true for Rose. | boolean |
| startAngle | Starting angle of the first slice in degrees. Measured counterclockwise from the 3 o'clock position. 90 degrees starts at 12 o'clock. | number |
| selectedMode | Determines how many slices can be selected at a time.
| string |
| selectedOffset | How far a selected slice is offset from the center in pixels. | number |
| backgroundColor | Chart background fill color. Can be chosen from color wheel, chosen from color palette, or entered as RGB or HSL value. See Color Selector. | color |
| animation | If true, enable entry and update animations. Default is true. | boolean |
| animationDuration | Duration of the initial render animation and the data change transition, in milliseconds. | number |
Component Events
Further component interaction and functionality can be configured for all components through scripting and event actions. Right-click on the component or select Components from the Designer menubar to access the configuration popups for both of these options:
- Configure Events: Accesses the Event Configuration popup where you can configure actions to run in response to events to make the component dynamic. The Events Configurations page shows how to configure events and actions on a Perspective component.
- Configure Scripts: Accesses the Script Configuration popup where custom methods and message handlers can be added. The Scripting in Perspective section details scripting fundamentals, creating custom methods, and using message handlers.
The Pie Chart component also has Component Events associated with it. See the Perspective - Pie Chart Scripting page for more information.
Examples
In the examples below, we'll be creating three different pie charts, one for each component variant.
-
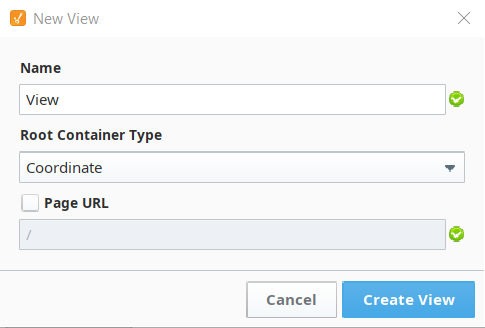
From the Perspective section of the Project Browser in your Designer, right-click on the Views folder and select New View... to create a new view. The New View popup will display.
-
Give your view a name and ensure the Coordinate Root Container Type is selected. The Page URL setting will remain unchecked for this example.
-
Click to expand the Perspective Components Palette, and click the Pie icon to display all Pie Chart variants.
-
Drag and drop a Pie Chart variant onto your newly created view.
Proceed to one of examples below depending on your selection, and try entering the sample data into your component's properties to see how your chart changes.
In the Basic Pie Chart Example, the sample data provided contains the default values for this component.
Basic Pie Chart Example
The following is an example of a Basic variant of the Pie Chart component. The sample data used to display this chart is listed below in JSON format.
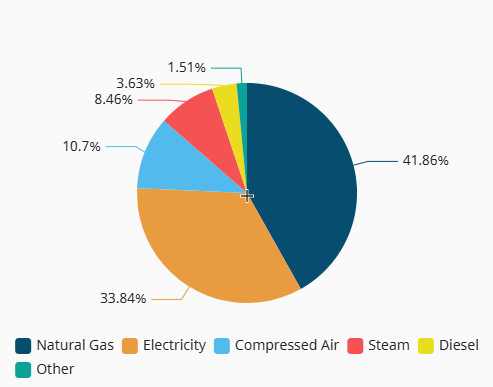
{
  "data": [
    {"name": "Natural Gas",    "value": 4850},
    {"name": "Electricity", 	 "value": 3920},
    {"name": "Compressed Air", "value": 1240},
    {"name": "Steam",    	 "value": 980},
    {"name": "Diesel",         "value": 420}
    {"name": "Other",          "value": 175}
  ],
  "labels": {
    "visible": true,
    "position": "outside",
    "content": "percent",
    "fontSize": 12,
    "lineVisible": true
  },
  "centerLabel": {
    "visible": false
  },
  "legend": {
    "visible": true,
    "position": "bottom",
    "orientation": "horizontal",
    "interactive": true
  },
  "appearance": {
    "innerRadius": 0,
    "outerRadius": "55%",
    "centerX": "50%",
    "centerY": "50%",
    "borderRadius": 0,
    "selectedMode": "single",
    "selectedOffset": 10,
    "animation": true,
    "tooltip": { "enabled": true }
  }
}
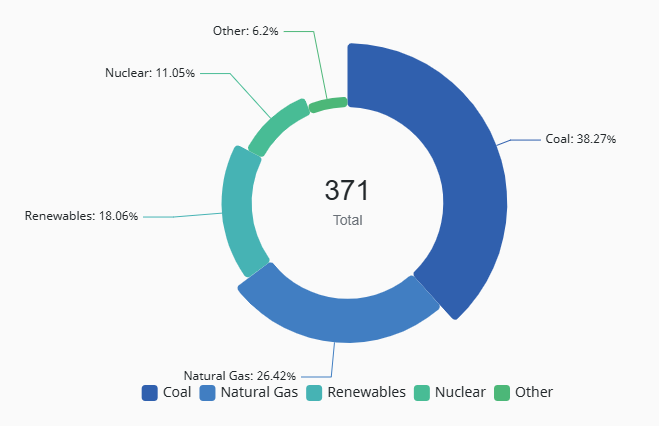
Donut Pie Chart Example
The following is an example of a Donut variant of the Pie Chart component. The sample data used to display this chart is listed below in JSON format.
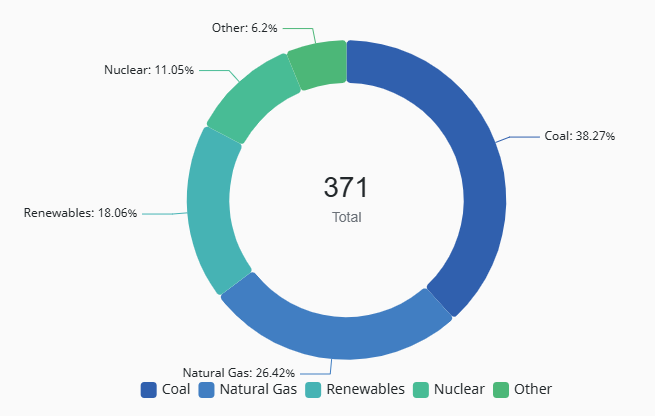
{
  "data": [
    { "name": "Coal",        "value": 142, "color": "#1A5FAD" },
    { "name": "Natural Gas", "value": 98,  "color": "#2B7EC1" },
    { "name": "Renewables",  "value": 67,  "color": "#18B4B4" },
    { "name": "Nuclear",     "value": 41,  "color": "#1BBD96" },
    { "name": "Other",       "value": 23,  "color": "#2DB87A" }
  ],
  "labels": {
    "visible": true,
    "position": "outside",
    "content": "nameAndPercent",
    "fontSize": 12,
    "lineVisible": true
  },
  "centerLabel": {
    "visible": true,
    "primaryText": "371",
    "primaryFontSize": 28,
    "secondaryText": "Total",
    "secondaryFontSize": 14
  },
  "legend": {
    "visible": true,
    "position": "bottom",
    "orientation": "horizontal",
    "interactive": true
  },
  "appearance": {
    "innerRadius": "55%",
    "outerRadius": "75%",
    "centerX": "50%",
    "centerY": "50%",
    "borderRadius": 4,
    "selectedMode": "single",
    "selectedOffset": 10,
    "animation": true,
    "tooltip": { "enabled": true }
  }
}
Rose Pie Chart Example
The following is an example of a Rose variant of the Pie Chart component. The sample data used to display this chart is listed below in JSON format.
{
  "data": [
    { "name": "Coal",        "value": 142, "color": "#1A5FAD" },
    { "name": "Natural Gas", "value": 98,  "color": "#2B7EC1" },
    { "name": "Renewables",  "value": 67,  "color": "#18B4B4" },
    { "name": "Nuclear",     "value": 41,  "color": "#1BBD96" },
    { "name": "Other",       "value": 23,  "color": "#2DB87A" }
  ],
  "labels": {
    "visible": true,
    "position": "outside",
    "content": "nameAndPercent",
    "fontSize": 12,
    "lineVisible": true
  },
  "centerLabel": {
    "visible": true,
    "primaryText": "371",
    "primaryFontSize": 28,
    "secondaryText": "Total",
    "secondaryFontSize": 14
  },
  "legend": {
    "visible": true,
    "position": "bottom",
    "orientation": "horizontal",
    "interactive": true
  },
  "appearance": {
    "innerRadius": "45%",
    "outerRadius": "75%",
    "centerX": "50%",
    "centerY": "50%",
    "borderRadius": 4,
    "roseType": true,
    "selectedMode": "single",
    "selectedOffset": 10,
    "animation": true,
    "tooltip": { "enabled": true }
  }
}