Perspective - Bar

Component Palette Icon:

The Bar component is a foundational comparison chart that plots one or more series of data as vertical columns against a category axis.
The Bar component has four pre-configured variants:
- Vertical: Bars drawn as vertical columns growing up from the category axis. This orientation is well-suited to comparing values across a small number of short category labels. This variant is the default orientation.
- Horizontal: Bars drawn as horizontal rows growing right from the category axis. This orientation is well-suited to ranked comparisons and long category labels that would not fit within a vertical column.
- Stacked: A multi-series chart where series sharing a category are stacked into a single bar per category, with the combined height representing the total.
- Diverging: A horizontal chart where series diverged from a shared baseline. Positive values extend in one direction, while negative values extend in the other. This variant is useful for comparing two opposing measures per category.
Properties
Most Properties have binding options. For more information on bindings, see Types of Bindings in Perspective.
This section only documents the props category of properties. The other categories are described on the Perspective Component Properties page.
| Name | Description | Property Type |
|---|---|---|
| data | The data source objects used to populate the chart. Each row represents a category, and the populated series reads the corresponding value from a named field on that row. | object |
| series | The series configuration per entry of bars. Options include:
| object |
| stackGroups | Series in the same group stack into one bar per category, with an optional label for the total. Leave empty to draw every series as its own bar. Bars stack in the order the series are declared, not the order listed here. See the stackGroups property table for more details. | object |
| xAxis | The x-axis configuration settings. On a vertical chart this is the category axis, while on a horizontal chart it is the value axis. Options include:
| object |
| yAxis | The y-axis configuration, where each array element applies to each y-axis. The default array is the primary axis. More axes can be added for dual-axis layouts. On a horizontal chart the y-axis is the category axis. Options include:
| object |
| title | Chart title and subtitle configuration.
| object |
| legend | The legend configuration.
| object |
| zoom | Zoom and pan settings. Users can zoom along the x-axis, y-axis, or both.
| object |
| tooltip | The tooltip shown on hover. Any setting configured with series.x.advanced.tooltip will override this property.
| object |
| axisPointer | The band, line, or crosshair that follows the hovered category along the axes, and its label.
| object |
| appearance | Configures the chart theme and layout.
| object |
| style | Sets a style for this chart. Full menu of style options is available for text, background, margin and padding, border, shape and miscellaneous. You can also specify a style class. | object |
series.x.dataLabels Properties
| Property | Description | Property Type |
|---|---|---|
| visible | Shows or hides the value label at each bar. Default is false. | boolean |
| position | Determines where the label sits relative to its bar. | string |
| format | The label's text. Label text can include the following tokens, which refer to the corresponding bar data:
| string |
| color | The color of the data label text. Overrides elementStyle.color when both are set. | color |
| fontSize | Font size of the data label text. Overrides elementStyle.fontSize when both are set. | numeric |
| elementStyle | Text style for a label rendered onto a chart canvas, including typography, alignment, box styling, and shadow. | object |
stackGroups Properties
| Property | Description | Property Type |
|---|---|---|
| series | Assigns the series that belong to a group, by label, or position in the series list. A series can only be assigned to a single group, so the first group that lists it will be where it belongs. Entries matching nothing are ignored, as are hidden series. A group with no series will not display any data. | object |
| totalLabel | The label for the stack's total, displayed at the end of the bar. Each series keeps its own data label, so segments and totals can both be shown.
| object |
appearance.sort Properties
| Property | Description | Property Type |
|---|---|---|
| type | The order bars appear in along the category axis. Options include:
| string |
| field | The series values to sort by when there is more than one. Defaults to the first series. This property will be ignored when type is set to natural or live. | string |
tooltip Formatting Options
Tooltip display can be customized with the following built-in formatting properties and token options. Tokens serve as placeholders that will be replaced with live data during runtime. They are case-sensitve, include no spaces, and must be enclosed with curly braces. Index suffixes are accepted when entered as the series number following a colon.
All tooltips will render using the en-US locale unless otherwise specified. When translated, text is processed as a whole phrase. Additionally, tooltips are HTML, so basic markup works within templates. However, the tooltip value expression is not HTML so <b>{value}</b> shows the value literally. The table below describes the available tokens that can be used, as well as some possible format examples.
| Token | Description | Example Format | Example Output |
|---|---|---|---|
{value} | The y-axis value. When value is selected as the format.type, default dropdown options include %, kW, and °F. However, any unit can be entered before or after {value} by typing directly into the field for either type selection. | |  |
{marker} | Displays the series[].color selection as an identifying marker dot. Available for template types only. | |  |
{series} | Displays the series[].label text. Available under template types only. | |  |
{category} | Displays the x-axis value. Available under template types only. | |  |
{sum} | Displays the total y-axis value for all series data sharing an x-axis category. Available under template types for stacked and diverging variants only. | |   |
Script and Event Configuration
Further component interaction and functionality can be configured for all components through scripting and event actions. Right-click on the component or select Components from the Designer menubar to access the configuration popups for both of these options:
- Configure Events: Accesses the Event Configuration popup where you can configure actions to run in response to events to make the component dynamic. The Events Configurations page shows how to configure events and actions on a Perspective component.
- Configure Scripts: Accesses the Script Configuration popup where custom methods and message handlers can be added. The Scripting in Perspective section details scripting fundamentals, creating custom methods, and using message handlers.
The Bar component also has Component Events associated with it. See the Perspective - Bar Scripting page for more information.
Basic Bar Chart Example
This example uses the default data for the vertical chart variant. Slight configuration changes were made to use the datalabels, the axisPointer, and sort properties to improve chart readability at a glance. The sample values used in this example are listed below in JSON format.
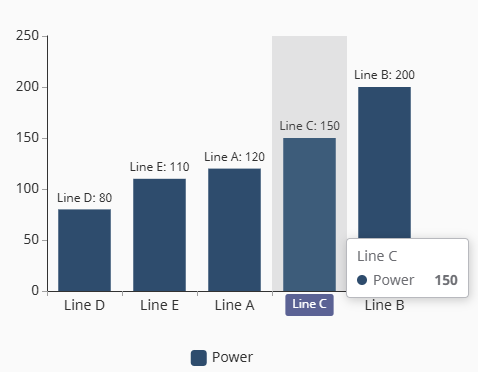
{
    "series": [
        {
         "dataLabels": {
            "visible": true,
            "format": "{category}: {value}",
         },
        }
    ],
    "axisPointer": {
        "type": shadow
    },
    "appearance": {
        "sort": {
           "type": "ascending"
        }
    }
}
Stacked Bar Chart Example
The following example uses the default data for the stacked chart variant. Configuration changes were made to add more context to the chart, including a title and updated legend placement. The zoom property was also enabled so that the slider type could be used to view only the Wednesday and Thursday bar data. The sample values used in this example are listed below in JSON format.
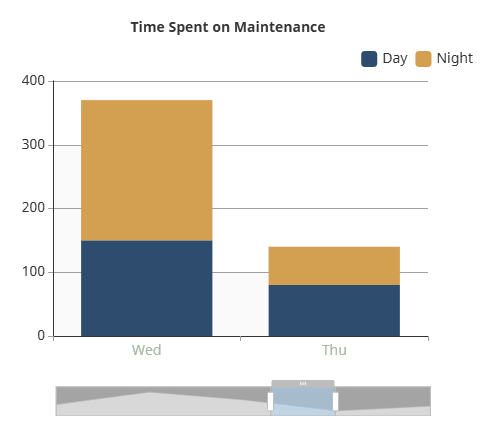
[
   {
      "xAxis": {
         "label": {
            "color": "#9DBAA3"
         }
      },
      "yAxis": {
         "gridLines": {
            "visible": true
         }
      },
      "title": {
         "text": "Time Spent on Maintenance"
      },
      "legend": {
         "position": "top-right"
      },
      "zoom": {
         "enabled": true,
         "type": "slider",
         "yPosition": "left",
         "backgroundColor": "#A4A4A4"
      }
   }
]