Version: 2027.02 Beta
View as Markdown

Perspective - Area

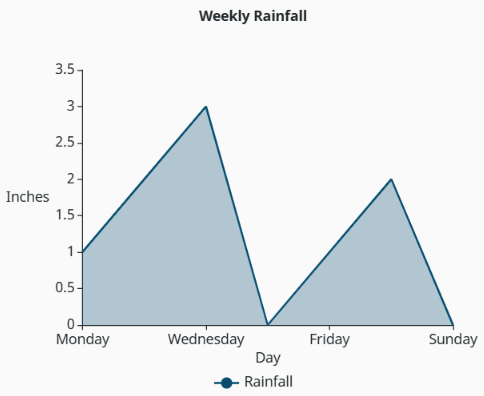
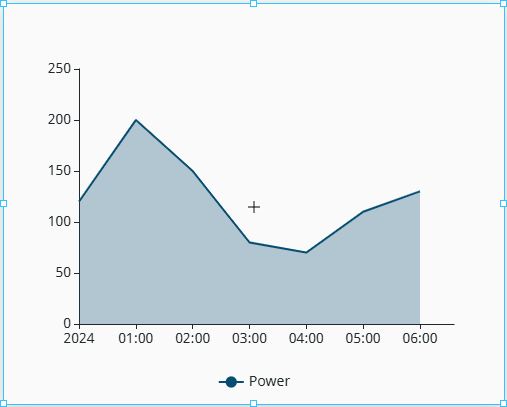
The default display for the Area component.

Component Palette Icon:

The Area component palette icon within the Perspective Components panel.

The Area component provides a way to communicate volume or magnitude in addition to trend direction. Similar to a Line component, each pen (an individual data series) in an Area component is independently bound to a data field and independently styled. Multiple pens can coexist on the same chart, share or split y-axes, and be configured with entirely different visual behaviors without any coupling between them.

The Area component has three pre-configured variants:

  • Basic: A line chart with the area beneath each series filled in. Communicates volume or magnitude with trend direction.
  • Pieces: An area chart where the fill beneath the line is applied conditionally based on threshold rules. It combines the visual weight of an area chart with the operational context of conditional coloring.
  • Stacked: A multi-series area chart where each series is stacked on top of the previous, with the combined height representing the total across all series. Common for visualizing part-to-whole relationships over time, such as energy consumption by source or production by line.

Properties​

Most Properties have binding options. For more information on Bindings, see Types of Bindings in Perspective. This section only documents the Props Category of properties. The other Categories are described on the Perspective Component Properties page.

NameDescriptionProperty Type
dataDataset powering the chart. Structured as an array of objects where each key represents a field that each series can reference by name.array
seriesA set of related data points. One object per pen. Each series is fully independent. See series Properties for more array properties.array
stackGroupsA series in the same group to stack on top of one another. Stacked in the order declared, not in the order listed in this array. Leave empty to draw every series on its own.array
xAxisConfiguration and styling options for the horizontal axis. See xAxis Properties for more details.object
yAxisConfiguration and styling options for the vertical axis. See yAxis Properties for more details.array
titleChart title and subtitle. See title Properties for more object properties.object
legendConfigures how the chart legend displays.
  • visible: Shows the legend when true. Default is true. Value is boolean.
  • position: Placement of the legend within the chart. Value is string.
  • orientation: Layout direction of legend items. Can be horizontal or vertical. Value is string.
  • interactive: Clicking a legend item toggles the visibility of that series when true. Default is true. Value is boolean.
  • color: Legend item text color. This value takes precedence over elementStyle.color when both are set. Can be chosen from color wheel, chosen from color palette, or entered as RGB or HSL value. See Color Selector.
  • fontSize: Legend item text size. This value takes precedence over elementStyle.fontSize when both are set. Value is number.
  • elementStyle: Visual style for a shape element rendered onto a chart canvas, including fill, stroke, opacity, shadow, and decoration.
object
visualMapGlobal conditional styling rules applied across all series. When enabled, overrides each series' line.color and line.type based on where the value falls within the defined threshold ranges. Applicable to the Pieces Area chart variant. See visualMap Properties for more object properties.object
zoomZoom and pan behavior. Allows users to zoom along the x-axis, y-axis, or both.
  • enabled: Scroll and drag zoom functionalities are enabled when true. Default is false. Value is boolean.
  • type: The type of zoom to apply. Value is string.
    • slider renders a visible scroll bar.
    • inside enables scroll-wheel and drag zoom with no visible slider.
    • both enables both the slider and drag zoom functionalities.
  • axis: Controls which axis the zoom applies to. Can be x, y, or both. Value is string.
  • xPosition: Position of the x-axis zoom slider when enabled. Can be top or bottom. Value is string.
  • yPosition: Position of the y-axis zoom slider when enabled. Can be left or right. Value is string.
  • height: The x-axis slider height in pixels. Applies when zoom.axis is x or both. Value is number.
  • width: The y-axis slider width in pixels. Applies when zoom.axis is y or both. Value is number.
  • backgroundColor: Background color of the slider track. Leave empty to use the chart theme default. Can be chosen from color wheel, chosen from color palette, or entered as RGB or HSL value. See Color Selector.
object
tooltipThe tooltip text shown on hover. Can be overriden by series.advanced.tooltip.
  • enabled: Shows the tooltip on hover for all pens when true. If false, no individual pen setting will be able to display the tooltip unless this value is set to true again. Default is true. Value is boolean.
  • trigger: Configures the way tooltips are displayed. Note to set this value first before modifying tooltip.formatter, since this value determines what tooltip.formatter, and each pen's own override, will do. Value is string.
    • axis shows one tooltip for every pen at the hovered x-axis value.
    • item shows a separate tooltip for the hovered point.
  • formatter: Configures how the tooltip text is built. Applies to each pen, but does not override series.advanced.tooltip if set.
    • type: The type of formatting to apply to the tooltip. value reformats the numbers inside the default tooltip. template replaces the whole default tooltip with your text. Value is string.
    • value: The formatting to apply to each value, keeping the default tooltip layout. Must contain the {value} key. Any text without {value} replaces the number. Value is string.
object
axisPointerThe line or crosshair that follows the hovered point along the axes, and the label it can print along the axes. See axisPointer Properties for more object properties.object
appearanceVisual configuration of the chart. Series-level properties take precedence when overlap occurs. See appearance Properties for more object properties.object
styleStyle configuration for the chart.object

series Properties​

NameDescriptionProperty Type
labelThe series display name. The label is visible in the legend and tooltips.string
valueField key from data to plot on the y-axis.string
lineConfigures the line stroke for the series.
  • type: The line pattern. Can be solid, dashed, or dotted. Value is string.
  • width: Line stroke width in pixels. Value is number.
object
smoothThe segment interpolation is curved when true. If false, the interpolation is rigid.boolean
areaConfigures the fill area beneath the line.
  • fillStyle: solid applies a flat fill, while gradient applies a top-to-bottom fade. Enables further gradient configuration properties when set to gradient. Value is string.
  • color: Fill color for the area beneath the line, overriding any per-range colors. Leave empty to let the fill follow the series color. If visualMap is enabled, each threshold range will tint its own stretch of the fill. Can be chosen from color wheel, chosen from color palette, or entered as RGB or HSL value. See Color Selector.
  • opacity: Fill opacity for the area beneath the line. Value is number.
  • gradientMode: fade applies a transparent, single-color fade from top-to-bottom. custom applies explicit start and end colors. Only relevant when area.fillStyle is gradient. Value is string.
  • gradientStart: Color at the top of the gradient. Defaults to series color. Only relevant when area.fillStyle is gradient. Can be chosen from color wheel, chosen from color palette, or entered as RGB or HSL value. See Color Selector.
  • gradientEnd: Color at the bottom of the gradient. Only relevant when area.fillStyle is gradient and area.gradientMode is custom. Can be chosen from color wheel, chosen from color palette, or entered as RGB or HSL value. See Color Selector.
object
pointsConfigures the data point dot(s) shown at each value, including styling.
  • visible: Renders a dot for each data point and enables formatting for those dots when true. Default is true. Value is boolean.
  • size: Radius of data point dots in pixels. Value is number.
  • fillColor: Dot fill color. Defaults to the series color. Can be chosen from color wheel, chosen from color palette, or entered as RGB or HSL value. See Color Selector.
  • outlineColor: Stroke color of the point outline. Can be chosen from color wheel, chosen from color palette, or entered as RGB or HSL value. See Color Selector.
  • outlineWidth: Stroke width of the point outline in pixels. Value is number.
  • shape: Shape of the data point dot. Value is string.
object
dataLabelsThe value label randered at each data point.
  • visible: Shows the value label rendered at each data point when true. Default is false. Value is boolean.
  • position: Position of the labels relative to data points. Value is string.
  • format: Format expression for the displayed value, rendering once per data point. Token options include {series}, {value} (y-axis value), {category} (x-axis value), and {dimension:<ref>}. Value is string.
  • color: Color of the data label text. Takes precedence over elementStyle.color when set. Can be chosen from color wheel, chosen from color palette, or entered as RGB or HSL value. See Color Selector.
  • fontSize: Font size of the data label text. Takes precedence over elementStyle.font when set. Value is number.
  • elementStyle: Visual style for a shape element rendered onto a chart canvas, including fill, stroke, opacity, shadow, and decoration.
object
visibleShows the pen without removing it when true. Default is true.boolean
referenceLinesRenders reference lines at threshold boundaries. This offers a persistent visual indicator of where value transitions occur, independent of the current data. See the series.referenceLines Properties section for more object properties.object
advancedConfigures less commonly used series settings. See the series.advanced Properties section for more object properties.object

series.referenceLines Properties​

NameDescriptionProperty Type
animationConfigures reference line entry and transition animations.
  • enabled: Enables the animation of reference lines on render and update when true. Default is true. Value is boolean.
  • entry: Initial animation applied when the reference lines first render.
    • duration: Entry animation duration in milliseconds. Value is number.
    • easing: Easing function applied to the entry animation. Value is string.
    • delay: Delay before the entry animation starts, in milliseconds. Value is number.
  • transition: Update animation applied when the reference lines change.
    • duration: Transition animation duration in milliseconds. Value is number.
    • easing: Easing function applied to the transaction animation. Value is string.
    • delay: Delay before the transition animation starts, in milliseconds. Value is number.
object
endpointsConfigures the dots drawn at the two ends of a reference line, including styling.
  • visible: Renders a dot at each end of every refence line on the chart when true. If false, both ends are hidden regardless of the points configured. Default is true. Value is boolean.
  • points: Styling for the end dots on a reference line. Provide one entry to share styling across both points, or two entries to style the start and end points independently. Value is array.
    • size: Radius of the endpoint symbol in pixels. Value is number.
    • shape: Shape of the endpoint symbol. Accepts a built-in name, image://url, image://data:image/... base64 URI, or path:// SVG path. Value is string.
object
itemsOrdered list of reference items.array

series.advanced Properties​

NameDescriptionProperty Type
yAxisEnables dual-axis layouts, and determines which y-axis the series binds to.number
stackGroupSeries sharing this key are stacked. Only applicable when area.enabled is true.string
connectNullsConnects the line across null or missing values when true. Default is false.boolean
stepRender as a step line at the start, middle, or end. Leave empty to disable step rendering.string
tooltipTooltip text settings for a single pen. When tooltip.trigger is set to item, all settings under this property will apply to the single pen tooltip. When set to axis, every pen along the axis shares one tooltip, so enabled and formatter will only apply to this row.
  • enabled: Shows the pen in the tooltip when true. When tooltip.trigger is axis, false drops the pen row. When tooltip.trigger is item, false displays no tooltip on hover. Value is boolean.
  • formatter: An expression used to format the displayed value for the tooltip, replacing chart-level settings. Leave empty to keep chart-level settings.
    • type: The format type of the expression. value reformats the numbers inside the default tooltip. template replaces the pen's text with your own. Value is string.
    • value: Applied to each of the pen's values, keeping the default row layout. When value is selected as the formatter.type, default dropdown options include %, kW, and °F. However, any unit can be entered before or after {value} by typing directly into the field for either type selection. Leave empty to use the chart-level setting. Value is string.
object

xAxis Properties​

NameDescriptionProperty Type
typeAxis scale type. Set to value to enable function (x,y) plotting.string
fieldDefault x-axis field for all series. Can be overridden per series via series configuration.string
visibleShows the x-axis on the chart when true. Default is true.boolean
positionSide of the chart the x-axis renders on.string
titleConfigures the x-axis title.
  • visible: Shows the x-axis title when true. Default is true. Value is boolean.
  • text: Axis title text. Leave empty for no title. Value is string.
  • color: Color of the axis title text. Leave empty to use the theme's label color. This value takes precedence over the elementStyle.color property. Can be chosen from color wheel, chosen from color palette, or entered as RGB or HSL value. See Color Selector.
  • fontSize: Font size of the axis title text. Takes precedence over the elementStyle.fontSize property. Value is number.
  • position: Where the title sits along the axis. Defaults to the center. Value is string.
  • gap: Distance in pixels between the axis title and the axis line. Value is number.
  • rotation: Axis title rotation in degrees. Value is number.
  • elementStyle: Visual style for a shape element rendered onto a chart canvas, including fill, stroke, opacity, shadow, and decoration.
object
minThe start value, or minimum boundary, of the x-axis. Accepts number, string, or auto.string
maxThe end value, or maximum boundary, of the x-axis. Accepts number, string, or auto.string
boundaryGapConfigures axis spacing at the data extremes. The categories will be inset from the edges of the axis when true.
  • For the category axis type, true places gaps at both edges.
  • For the time and value axis types, true places a gap at the end only.
boolean
gridLinesVertical grid line stroke configuration and styling.
  • visible: Shows vertical grid lines when true. Default is false. Value is boolean.
  • color: Color of the vertical gridlines. Can be chosen from color wheel, chosen from color palette, or entered as RGB or HSL value. See Color Selector.
object
axisLineAxis line stroke configuration and styling.
  • visible: Shows the axis line stroke when true. Ticks and labels remain visible independently. Default is true. Value is boolean.
  • color: Color of the axis line stroke. Can be chosen from color wheel, chosen from color palette, or entered as RGB or HSL value. See Color Selector.
object
ticksConfigures the tick marks along the x-axis.
  • visible: Shows tick marks along the axis when true. Default is true. Value is boolean.
  • displayInside: Renders tick marks on the inside of the axis line when true. Default is false. Value is boolean.
  • majorSplit: The number of value-axis tick intervals. auto sets to the recommended value. The final count may adjust for readability, and has no effect on category axis types. Value is string.
  • minorSplit: Number of minor tick intervals between two adjacent major ticks. Omit or set to 0 to hide. Value is number.
object
labelsConfigures tick label text.
  • visible: Shows tick label text when true. Default is true. Value is boolean.
  • color: Color of the tick label text. Takes precedence over the elementStyle.color property. Can be chosen from color wheel, chosen from color palette, or entered as RGB or HSL value. See Color Selector.
  • fontSize: Font size of the tick label text. Takes precedence over the elementStyle.fontSize property. Value is number.
  • rotation: Tick label rotation in degrees. Value is number.
  • width: Max width in pixels before overflow handling activates. Value is number.
  • overflow: Handles labels wider than the specified width value. Options include none, truncate, break, and breakAll. Value is string.
object
elementStyleVisual style for a shape element rendered onto a chart canvas, including fill, stroke, opacity, shadow, and decoration.object
advancedAdvanced optional settings for the x-axis. See the xAxis.advanced Properties section for object properties.object

xAxis.advanced Properties​

NameDescriptionProperty Type
axisPointerConfigures axis pointer settings for the x-axis alone. Only the x-axis shows a pointer, unless the chart-level shape is cross, which adds one on the y-axis as well. Turning the pointer off at the chart level will turn it off here as well.
  • enabled: Displays a pointer on the axis. auto follows the chart-level axis pointer. Leaving this value blank removes the pointer from the axis, while other axes keep their pointers. Tooltips will still display. Value is string.
  • type: Pointer shape for the axis, giving each axis its own cross pointer shape. Options include auto, shadow, line, and none. shadow requires the category axis type, and will shrink to a single pixel for value or time axis types. Value is string.
  • label: The pointer's label text.
    • visible: Displays the pointer label. Use this property to hide a cross pointer's y-axis label, which reports where the cursor is rather than a point's value. Default is auto. Value is string.
    • color: Color of the label. Leave empty to follow the chart-level color. Can be chosen from color wheel, chosen from color palette, or entered as RGB or HSL value. See Color Selector.
    • fontSize: Font size of the label. Empty follows the chart-level size. Value is number.
    • backgroundColor: Background color of the label box. Empty follows the chart-level color. Can be chosen from color wheel, chosen from color palette, or entered as RGB or HSL value. See Color Selector.
    • elementStyle: Visual style for a shape element rendered onto a chart canvas, including fill, stroke, opacity, shadow, and decoration.
object

yAxis Properties​

NameDescriptionProperty Type
visibleShows the y-axis on the chart when true. Default is true.boolean
titleConfigures the y-axis title.
  • visible: Shows the y-axis title when true. Default is true. Value is boolean.
  • text: Axis title text. Leave empty for no title. Value is string.
  • color: Color of the axis title text. Leave empty to use the theme's label color. This value takes precedence over the elementStyle.color property. Can be chosen from color wheel, chosen from color palette, or entered as RGB or HSL value. See Color Selector.
  • fontSize: Font size of the axis title text. Takes precedence over the elementStyle.fontSize property. Value is number.
  • position: Where the title sits along the axis. Defaults to the middle. Value is string.
  • gap: Distance in pixels between the axis title and the axis line. Value is number.
  • rotation: Axis title rotation in degrees. Value is number.
  • elementStyle: Visual style for a shape element rendered onto a chart canvas, including fill, stroke, opacity, shadow, and decoration.
object
minThe start value, or minimum boundary, of the y-axis. Accepts number, string, or auto.string
maxThe end value, or maximum boundary, of the y-axis. Accepts number, string, or auto.string
boundaryGapAxis spacing at the data extremes. The categories are inset from the edges of the axis when true. Default is true.
  • For the category axis type, true places gaps at both edges.
  • For the time and value axis types, true places a gap at the end only.
boolean
gridLinesHorizontal grid line stroke configuration.
  • visible: Shows horizontal grid lines when true. Default is false. Value is boolean.
object
axisLineAxis line stroke configuration.
  • visible: Shows the axis line stroke when true. Ticks and labels remain visible independently. Default is true. Value is boolean.
object
ticksConfigures tick marks along the y-axis.
  • visible: Shows tick marks along the axis when true. Default is true. Value is boolean.
  • displayInside: Renders tick marks on the inside of the axis line when true. Default is false. Value is boolean.
  • majorSplit: The number of value-axis tick intervals. auto sets to the recommended value. The final count may adjust for readability, and has no effect on category axis types. Value is string.
  • minorSplit: Number of minor tick intervals between two adjacent major ticks. Omit or set to 0 to hide. Value is number.
object
labelsConfigures tick label text.
  • visible: Shows tick label text when true. Default is true. Value is boolean.
  • color: Color of the tick label text. Takes precedence over the elementStyle.color property. Can be chosen from color wheel, chosen from color palette, or entered as RGB or HSL value. See Color Selector.
  • fontSize: Font size of the tick label text. Takes precedence over the elementStyle.fontSize property. Value is number.
  • rotation: Tick label rotation in degrees. Value is number.
  • width: Max width in pixels before overflow handling activates. Value is number.
  • overflow: Handles labels wider than the specified width value. Options include none, truncate, break, and breakAll. Value is string.
object
elementStyleVisual style for a shape element rendered onto a chart canvas, including fill, stroke, opacity, shadow, and decoration.object
advancedAdvanced optional settings for the y-axis. See the yAxis.advanced Properties section for object properties.object

yAxis.advanced Properties​

NameDescriptionProperty Type
axisPointerConfigures axis pointer settings for the y-axis alone. Only the x-axis shows a pointer, unless the chart-level shape is cross, which adds one on the y-axis as well. Turning the pointer off at the chart level will turn it off here as well.
  • enabled: Displays a pointer on the axis. auto follows the chart-level axis pointer. Leaving this value blank removes the pointer from the axis, while other axes keep their pointers. Tooltips will still display. Value is string.
  • type: Pointer shape for the axis, giving each axis its own shape under a cross pointer. Options include auto, shadow, line, and none. shadow requires the category axis type, and will shrink to a single pixel for value or time axis types. Value is string.
  • label: The pointer's label text.
    • visible: Shows the pointer label. Use this property to hide a cross pointer's y-axis label, which reports where the cursor is rather than a point's value. Default is auto. Value is string.
    • color: Color of the label. Leave empty to follow the chart-level color. Can be chosen from color wheel, chosen from color palette, or entered as RGB or HSL value. See Color Selector.
    • fontSize: Font size of the label. Empty follows the chart-level size. Value is number.
    • backgroundColor: Background color of the label box. Empty follows the chart-level color. Can be chosen from color wheel, chosen from color palette, or entered as RGB or HSL value. See Color Selector.
    • elementStyle: Visual style for a shape element rendered onto a chart canvas, including fill, stroke, opacity, shadow, and decoration.
object

title Properties​

NameDescriptionProperty Type
visibleShows the chart title when true. Default is true.boolean
textMain title text.string
colorColor of the main title text. Takes precedence over elementStyle.color when both are set. Can be chosen from color wheel, chosen from color palette, or entered as RGB or HSL value. See Color Selector.color
fontSizeFont size of the main title text. Takes precedence over elementStyle.fontSize when both are set.number
subtitleConfigures the subtitle displayed beneath the main title.
  • text: Subtitle text. Value is string.
  • color: Color of the subtitle text. Takes precedence over elementStyle.color when both are set. Can be chosen from color wheel, chosen from color palette, or entered as RGB or HSL value. See Color Selector.
  • fontSize: Font size of the subtitle text. Takes precedence over elementStyle.fontSize when both are set. Value is number.
  • elementStyle: Visual style for a shape element rendered onto a chart canvas, including fill, stroke, opacity, shadow, and decoration.
object
positionPosition of the title within the chart.string
gapPixel gap between the main title and subtitle.number
elementStyleVisual style for a shape element rendered onto a chart canvas, including fill, stroke, opacity, shadow, and decoration.object

visualMap Properties​

NameDescriptionProperty Type
enabledEnables conditional styling for all series on the chart when true. Default is false for the Basic and Stacked variants. Default is true for the Pieces variant.boolean
dimensionSpecifies which data dimension each point's min/max values are compared against, and in what units those bounds are expressed in. See the pieces.min property for more on how each axis type will read bounds.
  • y tests the plotted value of each point.
  • x tests the position of the point against the x-axis.
  • Entering a field name or column index as the value tests that dimension directly.
string
piecesOrdered list of threshold rules applied globally across all series. The last entry in this array will treat its max as inclusive. Points that do not match a piece are styled by the outOfRange property instead.array
outOfRangeConfigures the appearance of data that no threshold range applies to. When data is out of range, the value falls outside of each configured range, or the range is toggled off in the visualMap.legend property.object
legendConfigures the legend that displays each piece and range when visualMap is enabled. This legend is distinct from the chart main legend.
  • visible: Shows the legend when true. Default is true. Value is boolean.
  • position: Legend placement within the chart. Value is string.
  • orientation: Layout direction of legend items. Can be horizontal or vertical. Value is string.
  • interactive: Clicking a legend item toggles the range of the item when true. Any number of items can be toggled independently. If false, the legend is inert. Ranges that are toggled off are redrawn in the outOfRange color instead of being removed from the chart. Value is boolean.
  • color: The color of the legend item text. This value takes precedence over elementStyle.color when both are set. Can be chosen from color wheel, chosen from color palette, or entered as RGB or HSL value. See Color Selector.
  • fontSize: Font size of the legend item text. This value takes precedence over elementStyle.fontSize when both are set.
  • elementStyle: Visual style for a shape element rendered onto a chart canvas, including fill, stroke, opacity, shadow, and decoration.
object

axisPointer Properties​

NameDescriptionProperty Type
enabledShows the pointer for users when true. For tooltips, the pointer follows the hovered point even when the tooltip is hidden or tooltip.item is set to trigger. If false, the pointer and label are removed.boolean
typeThe pointer shape.
  • line is a single line.
  • shadow is a band as wide as one category on an x-axis.
  • cross is a crosshair pattern. This is the only shape that reaches the y-axis, and the only one that can label it.
  • none is no shape, leaving only the label.
string
labelThe label the pointer prints against the axis, showing the hovered x or y value. To change the tooltip formatting, use tooltip.formatter instead.
  • visible: Shows the pointer's label against the axis when true. The label will appear on the x-axis for every pointer shape. For the cross pointer shape, both x-axis and y-axis labels will appear. Default is false. Value is boolean.
  • color: Label text color. Leave empty for the default light or dark theme. Can be chosen from color wheel, chosen from color palette, or entered as RGB or HSL value. See Color Selector.
  • fontSize: Label text font size. Value is number.
  • backgroundColor: Fill color of the label box. Leave empty for the default light or dark theme. Can be chosen from color wheel, chosen from color palette, or entered as RGB or HSL value. See Color Selector.
  • elementStyle: Visual style for a shape element rendered onto a chart canvas, including fill, stroke, opacity, shadow, and decoration.
object

appearance Properties​

NameDescriptionProperty Type
colorPaletteThe chart color palette. Auto-assigned to the default theme.array
backgroundColorChart background fill color. Can be chosen from color wheel, chosen from color palette, or entered as RGB or HSL value. See Color Selector.color
animationConfigures chart-level entry and transition animation.
  • enabled: Enables animation on chart render and update when true. Value is boolean.
  • entry: Animation applied when the chart first renders.
    • duration: Entry animation duration in milliseconds. Value is number.
    • easing: Easing function applied to the animation. Value is string.
    • delay: Animation start delay in milliseconds. Value is number.
  • transition: Animation applied when the chart data changes.
    • duration: Transition animation duration in milliseconds. Value is number.
    • easing: Transition function applied to the animation. Value is string.
    • delay: Animation start delay in milliseconds. Value is number.
object

Component Scripts and Events​

Further component interaction and functionality can be configured for all components through scripting and event actions. Right-click on the component or select Components from the Designer menubar to access the configuration popups for both of these options:

  • Configure Events: Accesses the Event Configuration popup where you can configure actions to run in response to events to make the component dynamic. The Events Configurations page shows how to configure events and actions on a Perspective component.

  • Configure Scripts: Accesses the Script Configuration popup where custom methods and message handlers can be added. The Scripting in Perspective section details scripting fundamentals, creating custom methods, and using message handlers.

The Area component also has Component Events associated with it. See the Perspective - Area Scripting page for more information.

Examples​

Basic Area - Weekly Rainfall Example​

A basic area chart displaying the rainfall in inches from Monday to Friday.

Basic Area Chart - Weekly Rainfall
[
{
"type": "ia.canvas-charts.area",
"version": 0,
"props": {
"data": [
{
"value": 1,
"day": "Monday"
},
{
"value": 2,
"day": "Tuesday"
},
{
"value": 3,
"day": "Wednesday"
},
{
"value": 0,
"day": "Thursday"
},
{
"value": 1,
"day": "Friday"
},
{
"value": 2,
"day": "Saturday"
},
{
"value": 0,
"day": "Sunday"
}
],
"liveData": false,
"series": [
{
"label": "Rainfall",
"value": "value",
"line": {
"type": "solid",
"width": 2
},
"smooth": false,
"area": {
"fillStyle": "solid",
"color": "",
"opacity": 0.3,
"gradientMode": "fade",
"gradientStart": "#229AD6",
"gradientEnd": "#FFFFFF"
},
"points": {
"visible": false,
"size": 4,
"fillColor": "",
"outlineColor": "transparent",
"outlineWidth": 0,
"shape": "circle"
},
"dataLabels": {
"visible": false,
"position": "top",
"format": "{value}",
"color": "",
"fontSize": "",
"elementStyle": {}
},
"visible": true,
"referenceLines": {
"animation": {
"enabled": true,
"entry": {
"duration": 1000,
"easing": "cubicOut",
"delay": 0
},
"transition": {
"duration": 300,
"easing": "cubicOut",
"delay": 0
}
},
"endpoints": {
"visible": true,
"points": [
{
"size": 4,
"shape": "circle"
}
]
},
"items": []
},
"advanced": {
"yAxis": 0,
"connectNulls": false,
"step": "",
"tooltip": {
"enabled": true,
"formatter": {
"type": "value",
"value": "",
"template": ""
}
}
}
}
],
"xAxis": {
"type": "value",
"field": "day",
"title": {
"text": "Day"
},
"boundaryGap": false
},
"yAxis": [
{
"visible": true,
"title": {
"visible": true,
"text": "Inches",
"color": "",
"fontSize": "",
"position": "middle",
"gap": 15,
"rotation": 0,
"elementStyle": {}
},
"min": "auto",
"max": "auto",
"boundaryGap": true,
"gridLines": {
"visible": false
},
"axisLine": {
"visible": true
},
"ticks": {
"visible": true,
"displayInside": false,
"majorSplit": "auto",
"minorSplit": 0
},
"labels": {
"visible": true,
"color": "",
"fontSize": "",
"rotation": 0,
"width": null,
"overflow": "none",
"elementStyle": {}
},
"advanced": {
"axisPointer": {
"enabled": "auto",
"type": "auto",
"label": {
"visible": "auto",
"color": "",
"fontSize": "",
"backgroundColor": "",
"elementStyle": {}
}
}
}
}
],
"title": {
"text": "Weekly Rainfall",
"position": "top"
}
},
"meta": {
"name": "Area"
},
"position": {
"x": 201,
"y": 174,
"width": 500,
"height": 400
},
"custom": {}
}
]